

GALEX TDS Alerts
Current Status: (22-Oct-2010) checking has been temporarily suspended while the new spatial calibration for the NUV detector is implemented in the pipeline. Data are being taken, but variability tests will not be reliable until the new pipeline is implemented.
As new GALEX observations are ingested, they are checked for variable sources by the GALEX science team. Alerts for validated variable sources will be posted on this page.
Criteria: Variability, as defined in Stetson, P. B. (1996), is calculated using the NUV photometry in a 6-arcsecond aperture. This variability accounts for measurement errors. Any alert candidate must have a variability greater than 0.3. In addition, the objects must be within 30 arcminutes from the center of the field. The candidate variables are examined and spurious variables, due to artifacts, are culled. The completeness of this culling varies depending on the total number of candidates produced each day and the time available for culling, i.e., this list is in no way presented as complete at this time.The latest, culled GALEX variable alert notices are listed below.
NOTES: Be sure to refresh this page to view the latest alerts.
Alerts Archive: Currently displaying most recent two months.
| Epoch | Coordinate (J2000) | Delta NUV | Max NUV | Nobs NUV | Delta FUV | Max FUV | Nobs FUV | Type | ID | Comment | Links | NUV:FUV cutout | Light Curve |
|---|---|---|---|---|---|---|---|---|---|---|---|---|---|
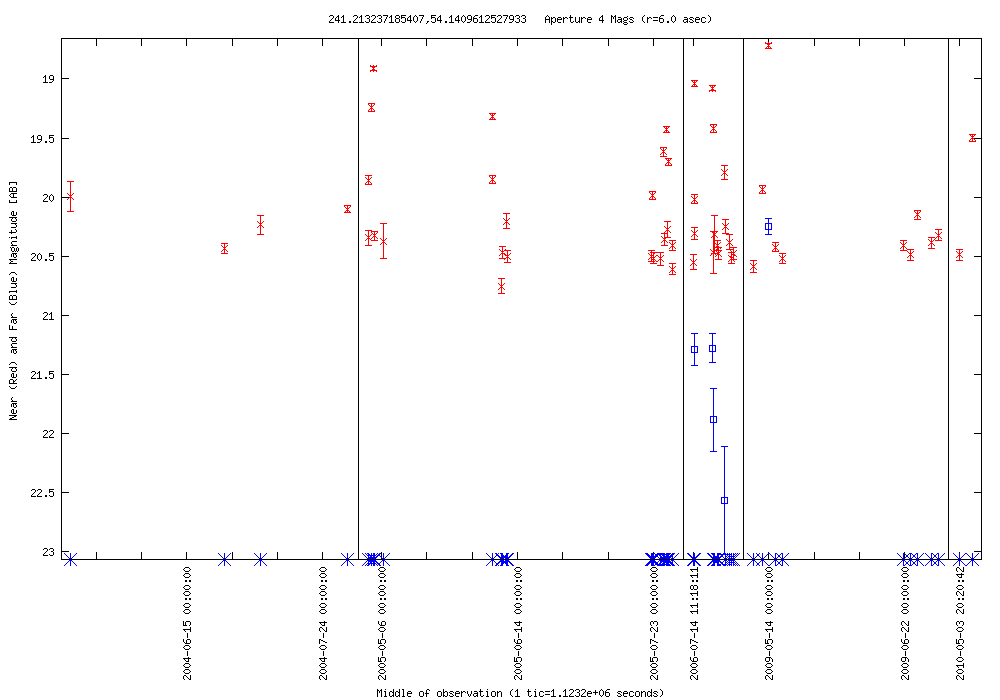
| 2010-05-03 20:05:28-07 | 241.21324 +54.14096 | 1.889 | 18.720 | 34 | 2.316 | 20.249 | 3 | RR Lyrae? | SDSS J160451.08+540827.6 | blue star | NED Simbad SDSS |  |
LC Plot |
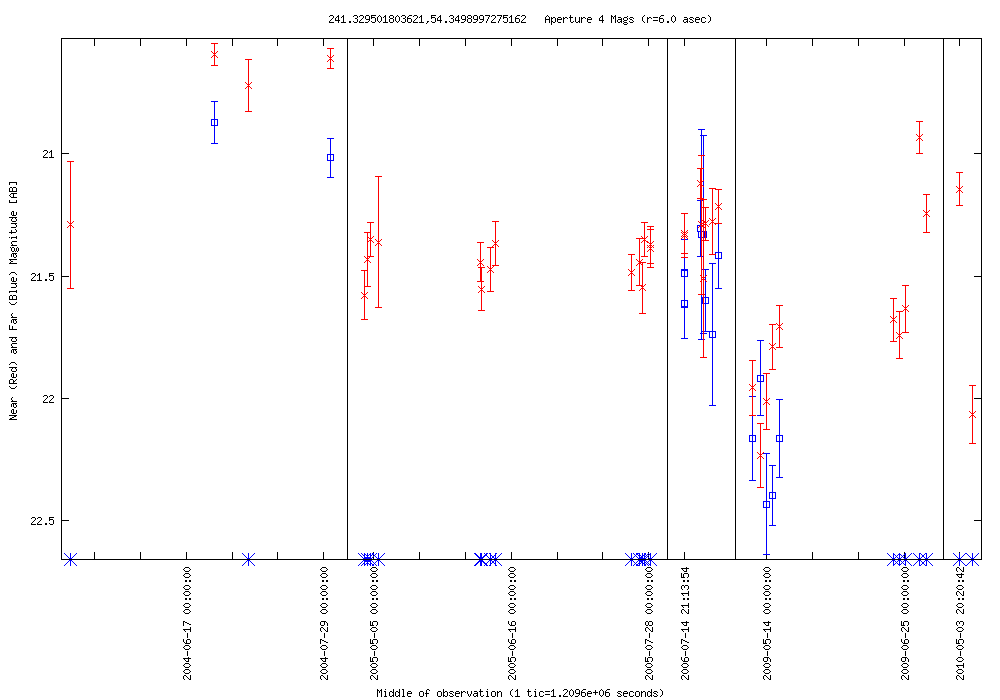
| 2010-05-03 20:05:28-07 | 241.32950 +54.34990 | 1.638 | 20.595 | 34 | 1.561 | 20.872 | 13 | AGN? | SDSS J160519.04+542059.9 | SDSS classified as a galaxy | NED Simbad SDSS |  |
LC Plot |
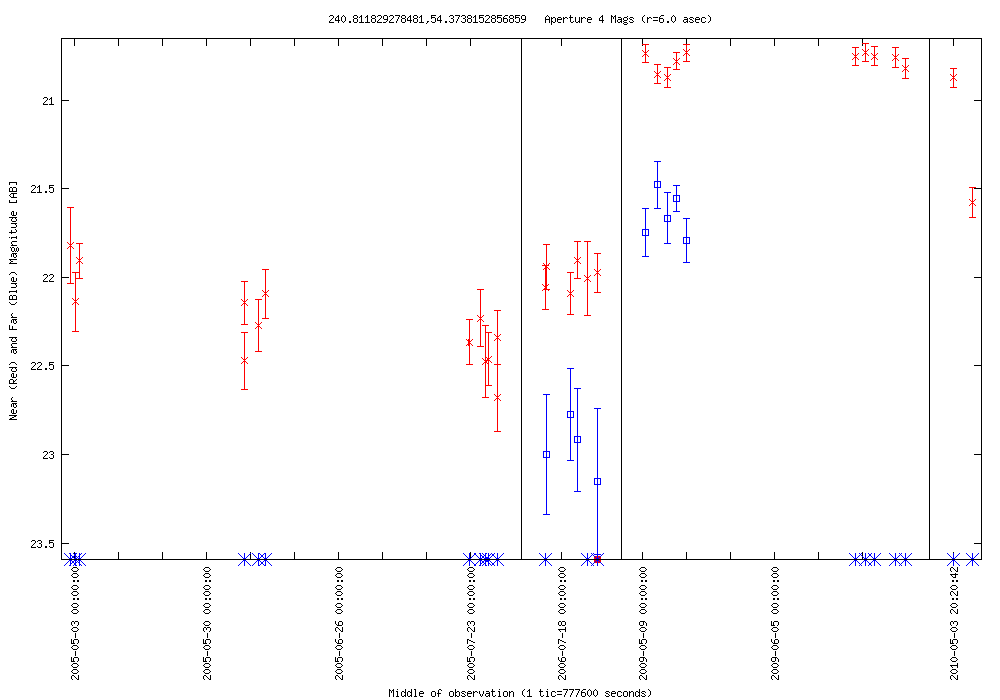
| 2010-05-03 20:05:28-07 | 240.81183 +54.37382 | 1.949 | 20.730 | 31 | 1.674 | 21.477 | 9 | AGN | [BLS2007] EN1-337826 | SDSS classified as a galaxy | NED Simbad SDSS |  |
LC Plot |
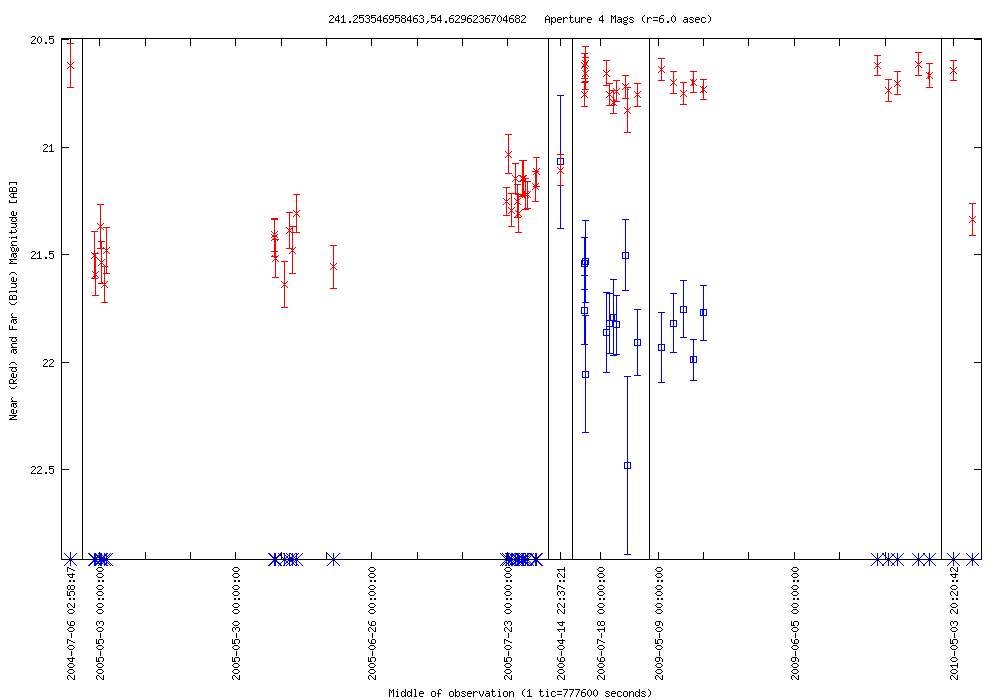
| 2010-05-03 20:05:28-07 | 241.25355 +54.62962 | 1.027 | 20.612 | 51 | 1.411 | 21.068 | 17 | UvES | SDSS J160500.82+543746.6 | blue galaxy | NED Simbad SDSS |  |
LC Plot |
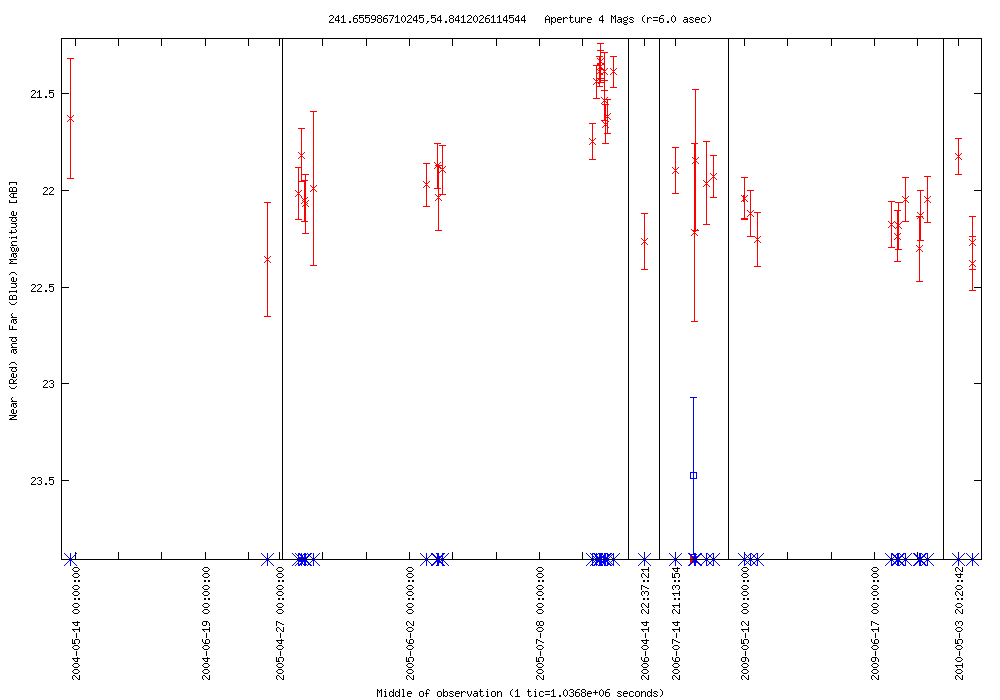
| 2010-05-03 20:05:28-07 | 241.65599 +54.84120 | 1.047 | 21.330 | 26 | 0.000 | 23.476 | 1 | VisS | SDSS J160637.31+545030.4 | SDSS classified as a star | NED Simbad SDSS |  |
LC Plot |
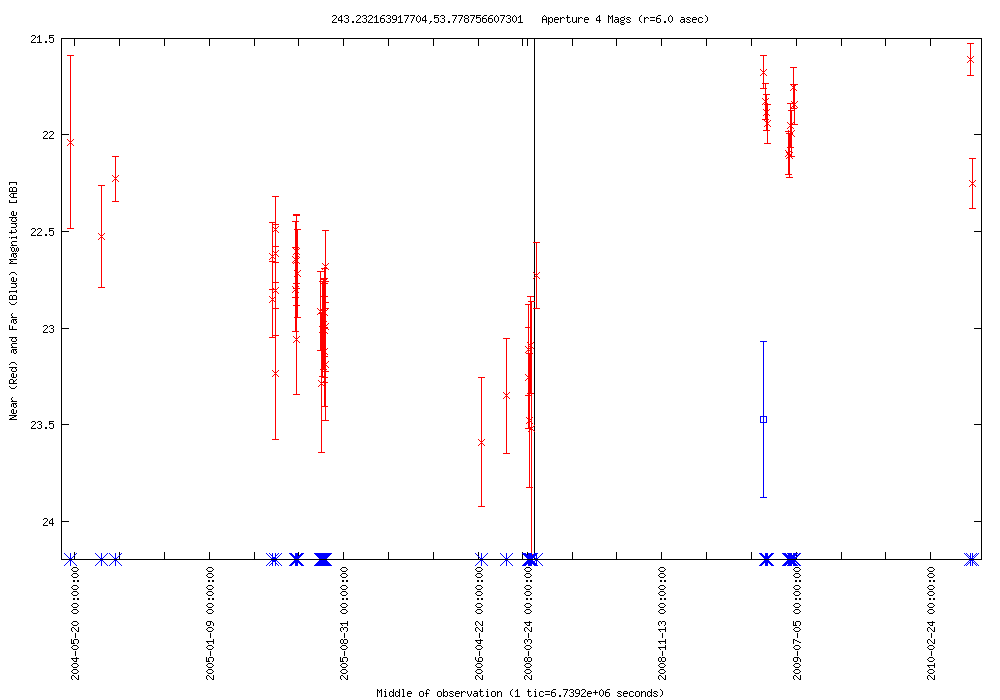
| 2010-05-03 18:26:51-07 | 243.23216 +53.77876 | 1.983 | 21.609 | 46 | 0.000 | 23.474 | 1 | VisS | SDSS J161255.78+534643.8 | faint galaxy | NED Simbad SDSS |  |
LC Plot |
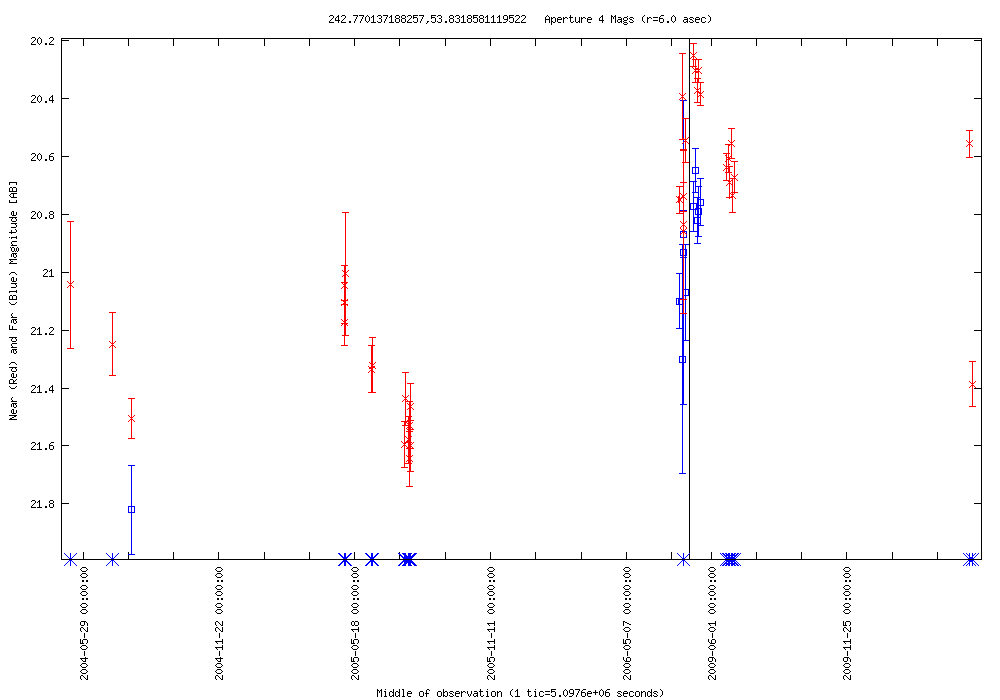
| 2010-05-03 18:26:51-07 | 242.77014 +53.83186 | 1.394 | 20.250 | 31 | 1.172 | 20.649 | 10 | AGN? | SDSS J161104.74+534955.9 | SDSS classified as a galaxy | NED Simbad SDSS |  |
LC Plot |
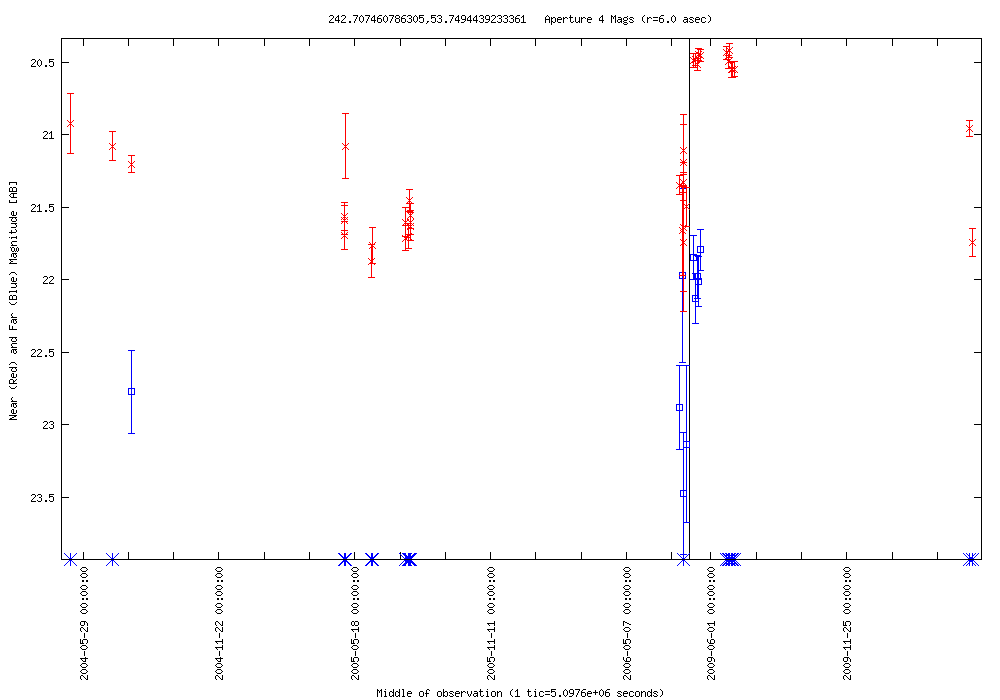
| 2010-05-03 18:26:51-07 | 242.70746 +53.74944 | 1.453 | 20.417 | 31 | 1.682 | 21.792 | 10 | AGN? | ELAIS10S(R) J161049.7+534458 | blue galaxy | NED Simbad SDSS |  |
LC Plot |
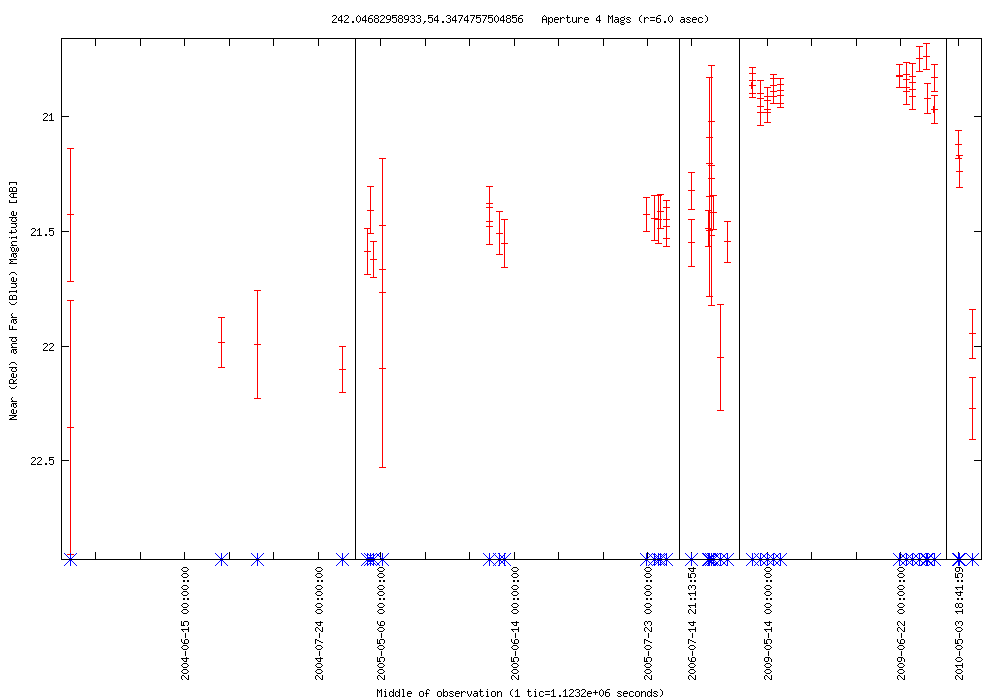
| 2010-05-03 18:26:51-07 | 242.04683 +54.34748 | 1.535 | 20.737 | 47 | 0.000 | 0.000 | 0 | UvES | SDSS J160811.31+542050.9 | SDSS classified as a star | NED Simbad SDSS |  |
LC Plot |
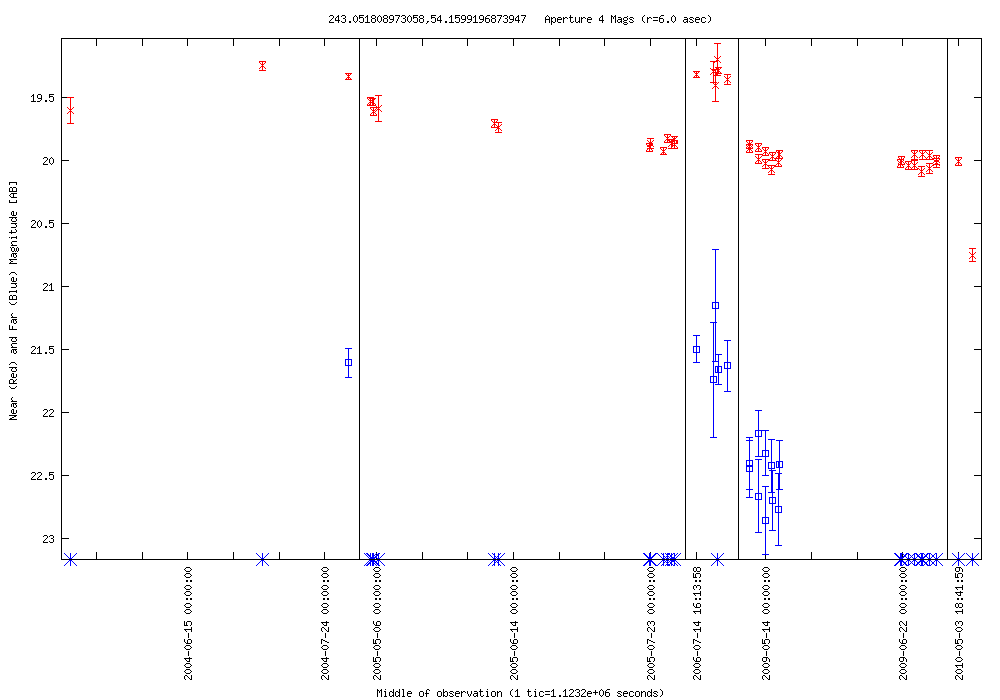
| 2010-05-03 18:26:51-07 | 243.05181 +54.15992 | 1.501 | 19.251 | 41 | 1.358 | 21.497 | 15 | IR source | ELAISC15 J161212+540937 | SDSS classified as a star | NED Simbad SDSS |  |
LC Plot |
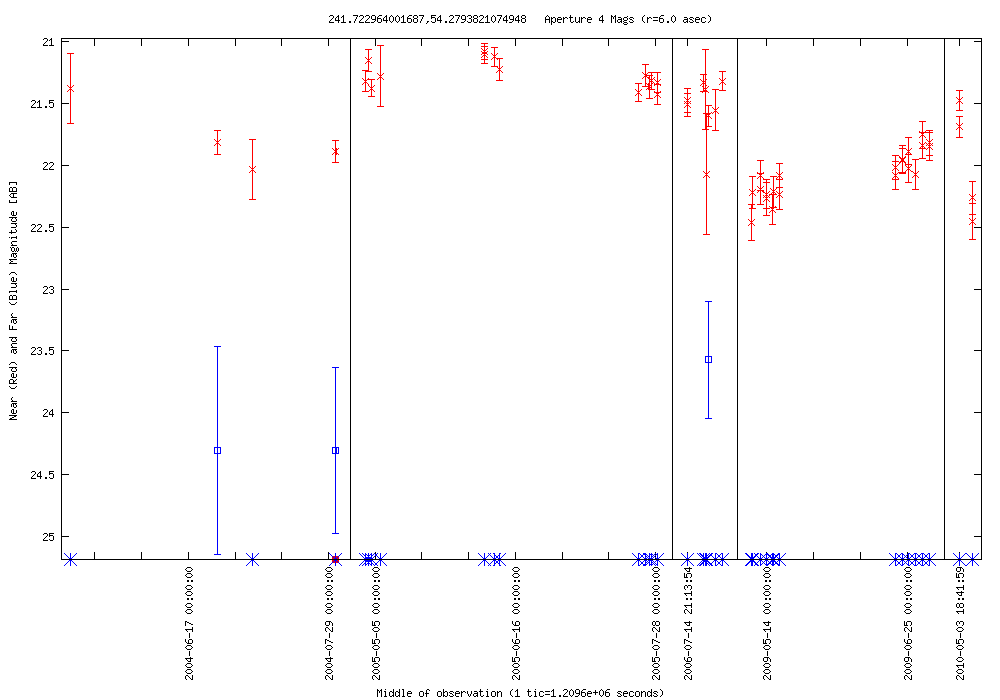
| 2010-05-03 18:26:51-07 | 241.72296 +54.27938 | 1.381 | 21.081 | 47 | 0.731 | 23.573 | 3 | UvES | SDSS J160653.43+541645.6 | SDSS classified as a star | NED Simbad SDSS |  |
LC Plot |
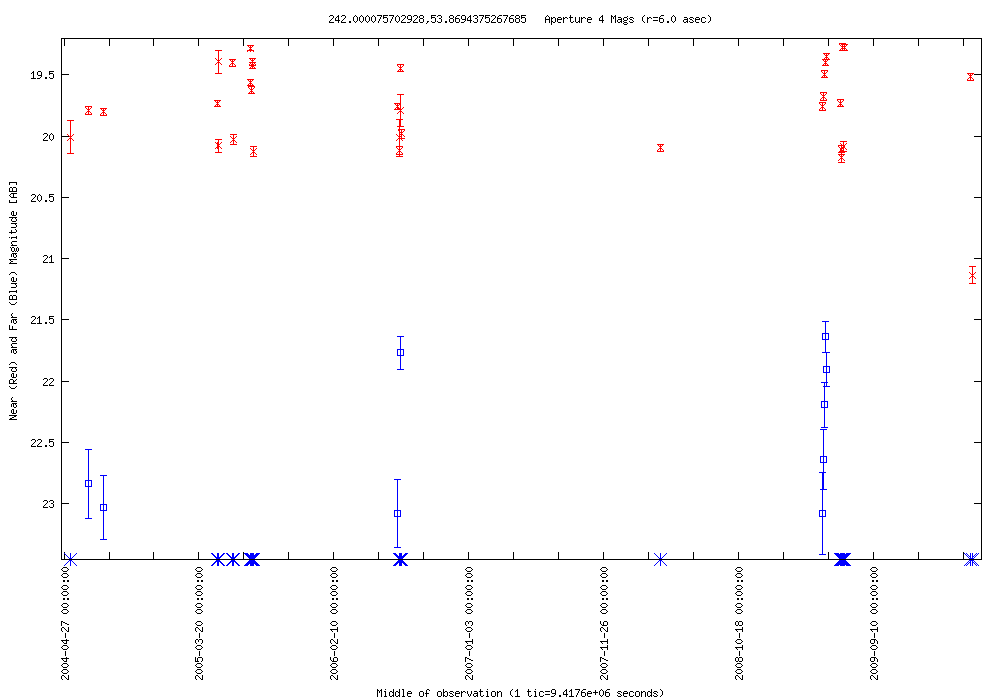
| 2010-05-03 18:26:51-07 | 242.00008 +53.86944 | 1.861 | 19.274 | 30 | 1.444 | 21.637 | 9 | RR Lyrae? | SDSS J160759.92+535210.1 | blue star | NED Simbad SDSS |  |
LC Plot |
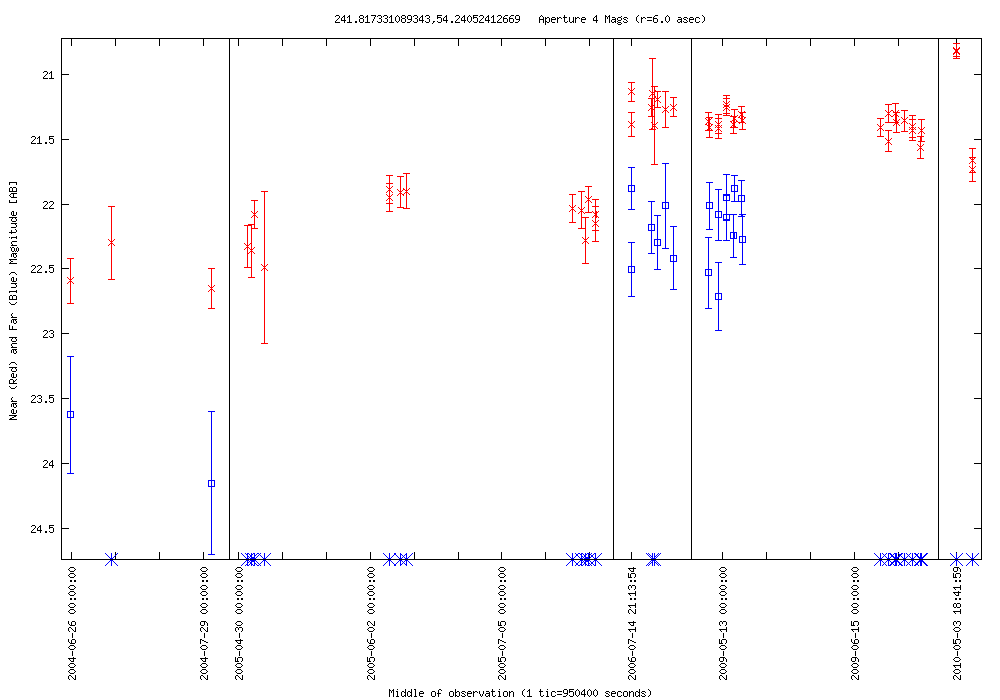
| 2010-05-03 18:26:51-07 | 241.81733 +54.24052 | 1.838 | 20.813 | 47 | 2.275 | 21.878 | 18 | VisS | SDSS J160716.16+541425.8 | SDSS classified as a star | NED Simbad SDSS |  |
LC Plot |
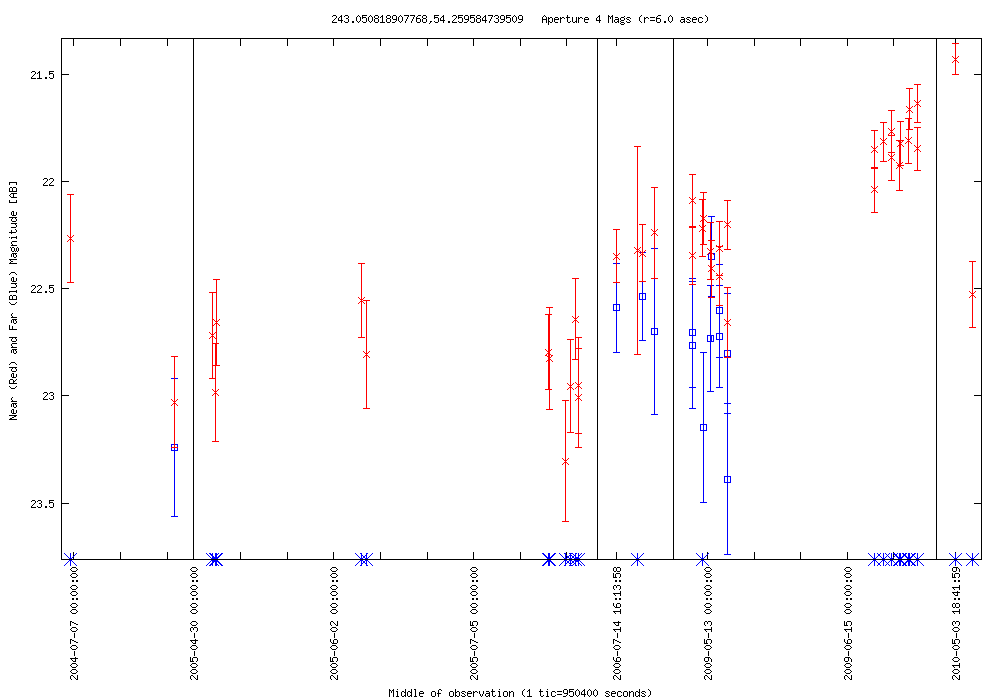
| 2010-05-03 18:26:51-07 | 243.05082 +54.25958 | 1.875 | 21.429 | 41 | 1.037 | 22.350 | 13 | AGN? | SDSS J161212.25+541535.1 | SDSS classified as a galaxy | NED Simbad SDSS |  |
LC Plot |
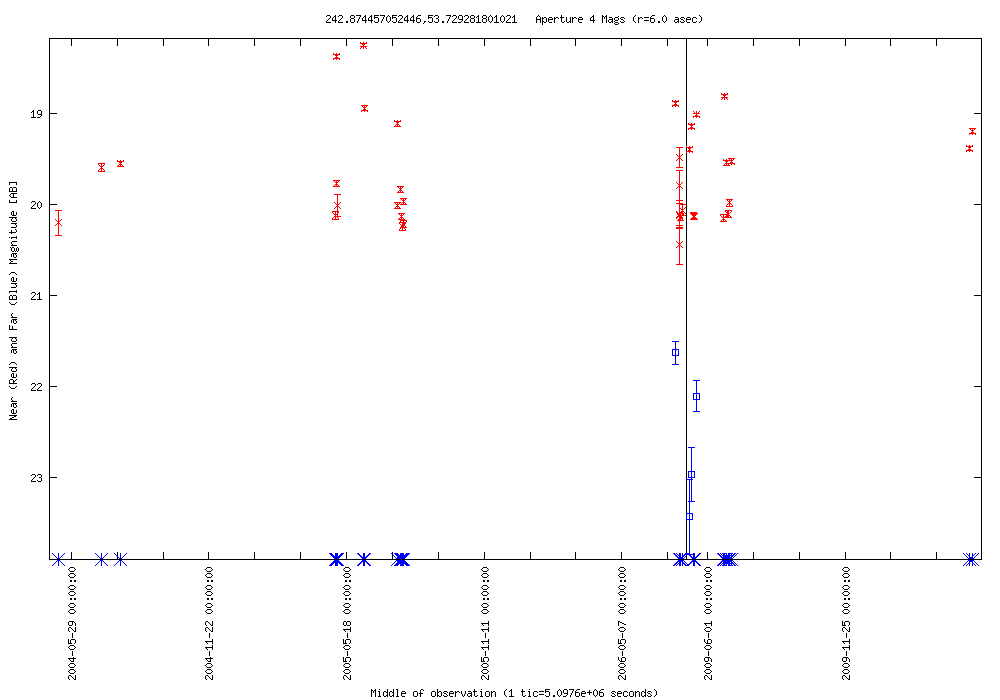
| 2010-05-03 18:26:51-07 | 242.87446 +53.72928 | 1.985 | 18.255 | 31 | 1.796 | 21.630 | 4 | RR Lyrae? | SDSS J161129.86+534345.8 | blue star | NED Simbad SDSS |  |
LC Plot |
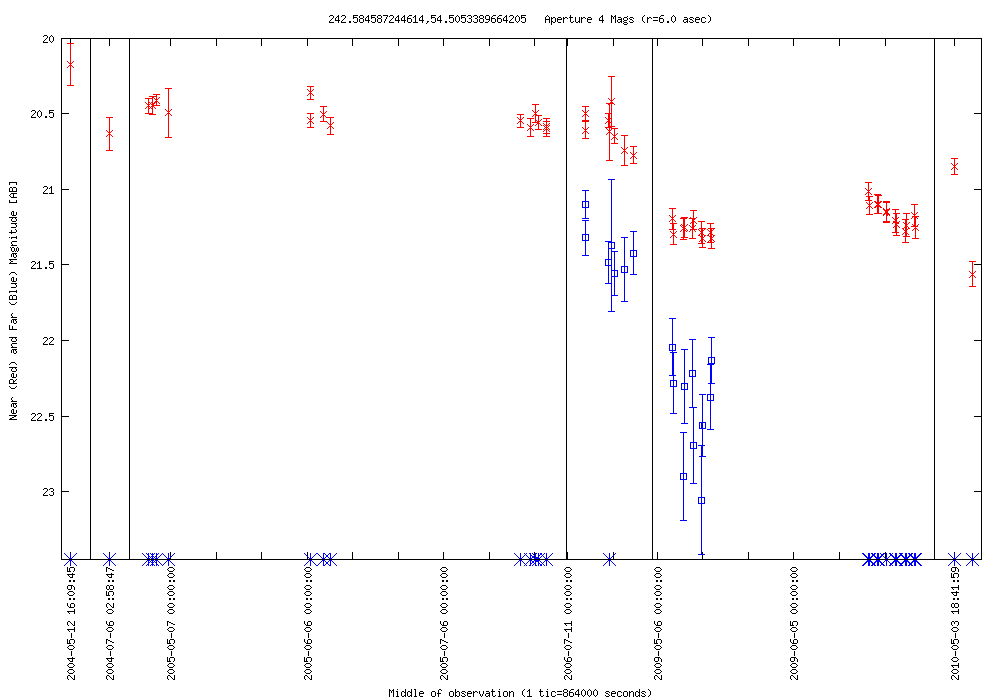
| 2010-05-03 18:26:51-07 | 242.58459 +54.50534 | 1.199 | 20.362 | 44 | 1.954 | 21.101 | 16 | AGN | CXOEN1 J161020.3+543020 | SDSS classified as a galaxy | NED Simbad SDSS |  |
LC Plot |
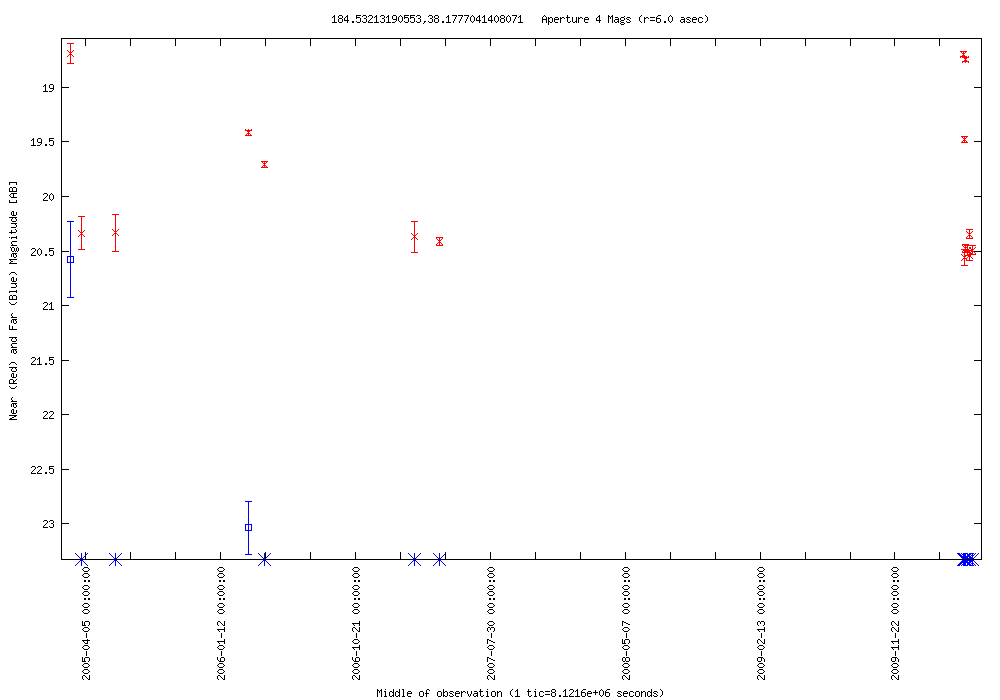
| 2010-05-03 00:22:08-07 | 184.53213 +38.17770 | 1.864 | 18.696 | 12 | 0.000 | 23.035 | 1 | DN? | SDSS J121807.70+381039.6 | blue star | NED Simbad SDSS |  |
LC Plot |
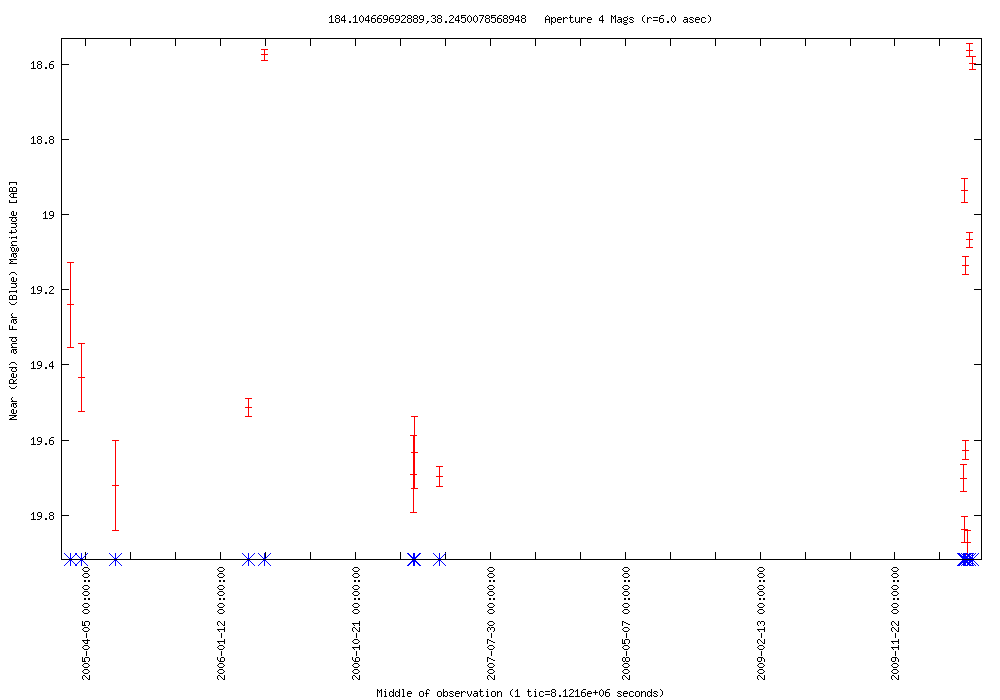
| 2010-05-03 00:22:08-07 | 184.10467 +38.24501 | 1.309 | 18.562 | 12 | 0.000 | 0.000 | 0 | DN? | SDSS J121625.04+381441.5 | blue star | NED Simbad SDSS |  |
LC Plot |
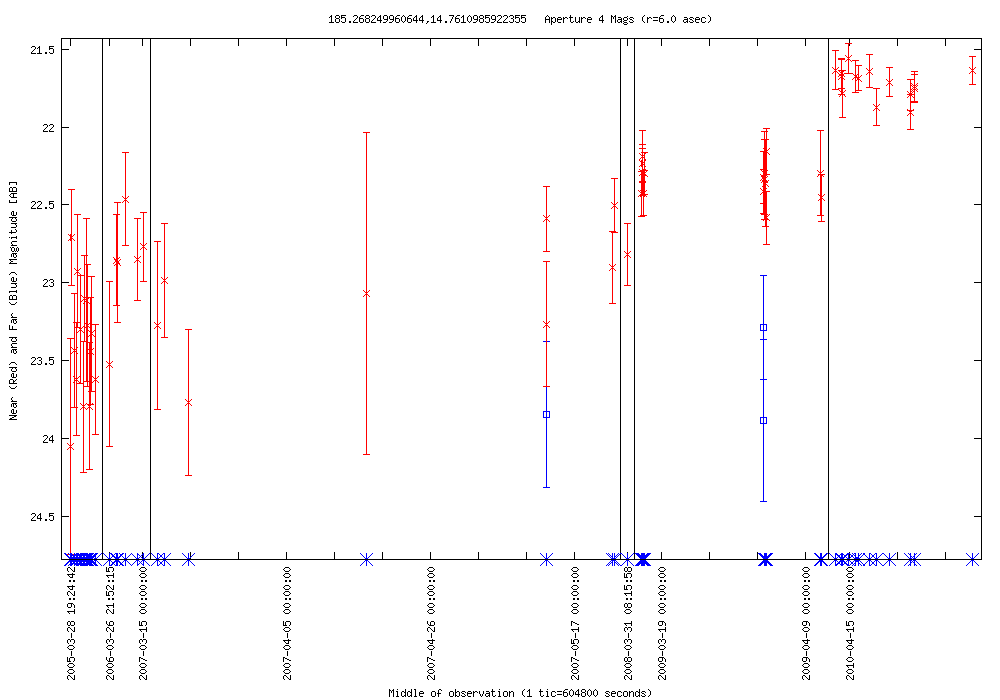
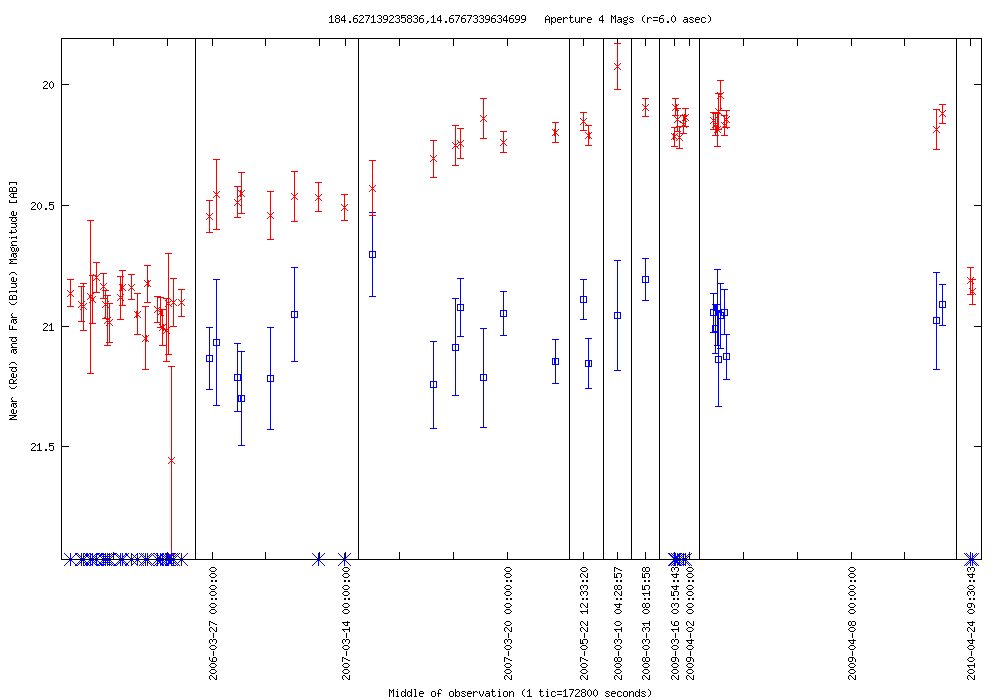
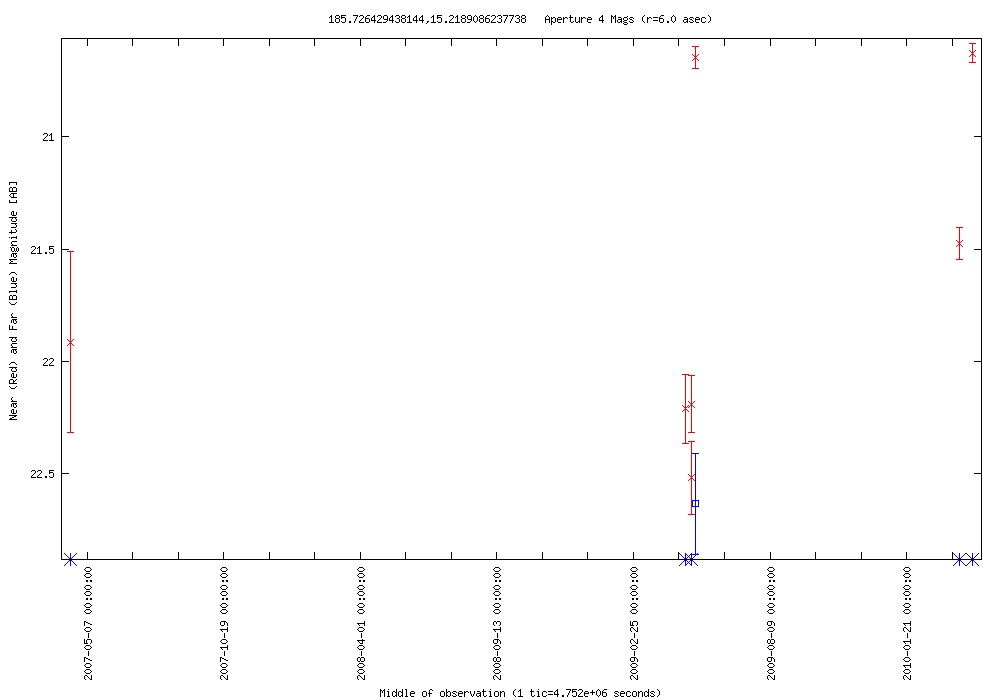
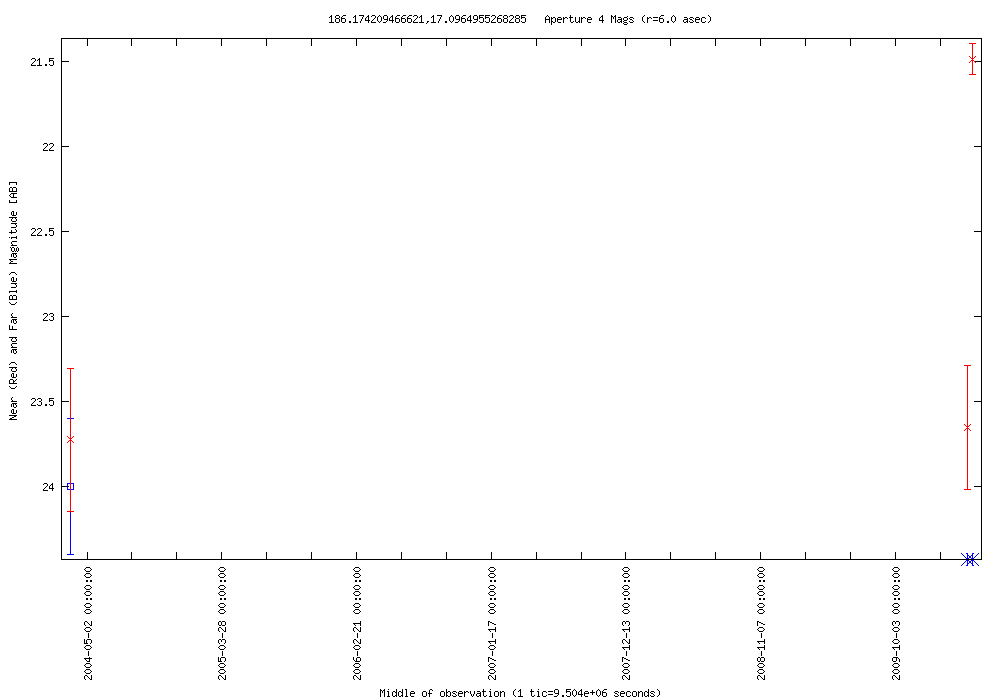
| 2010-05-02 21:04:54-07 | 185.26825 +14.76110 | 2.492 | 21.559 | 58 | 0.597 | 23.288 | 3 | AGN? | SDSS J122104.30+144539.6 | SDSS classified as a star | NED Simbad SDSS |  |
LC Plot |
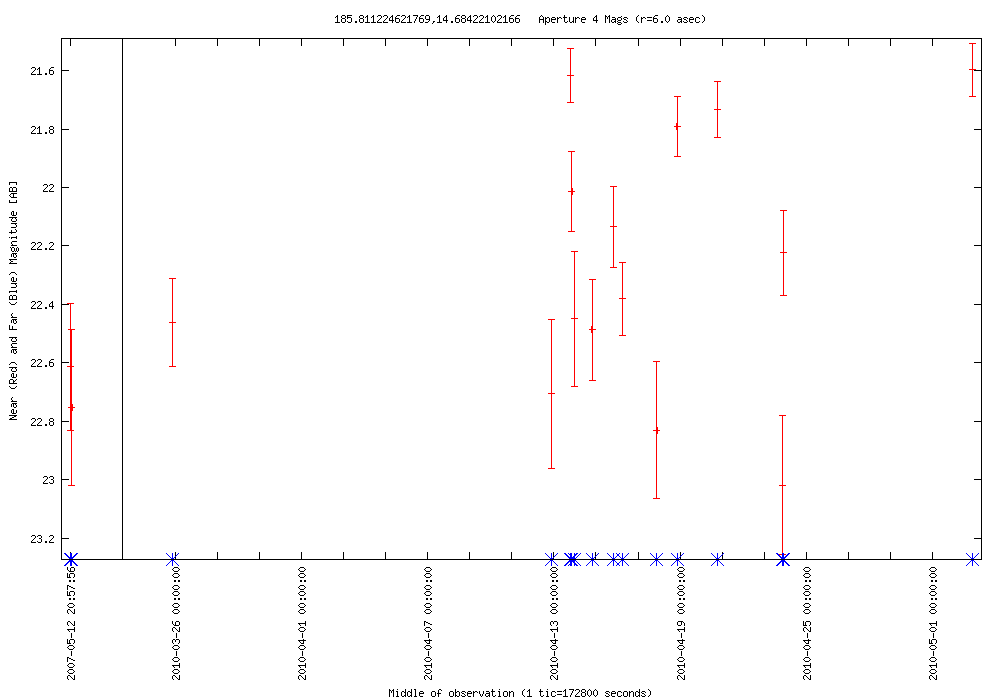
| 2010-05-02 21:04:54-07 | 185.81122 +14.68422 | 1.421 | 21.597 | 16 | 0.000 | 0.000 | 0 | AGN? | SDSS J122314.75+144103.3 | blue, stellar | NED Simbad SDSS |  |
LC Plot |
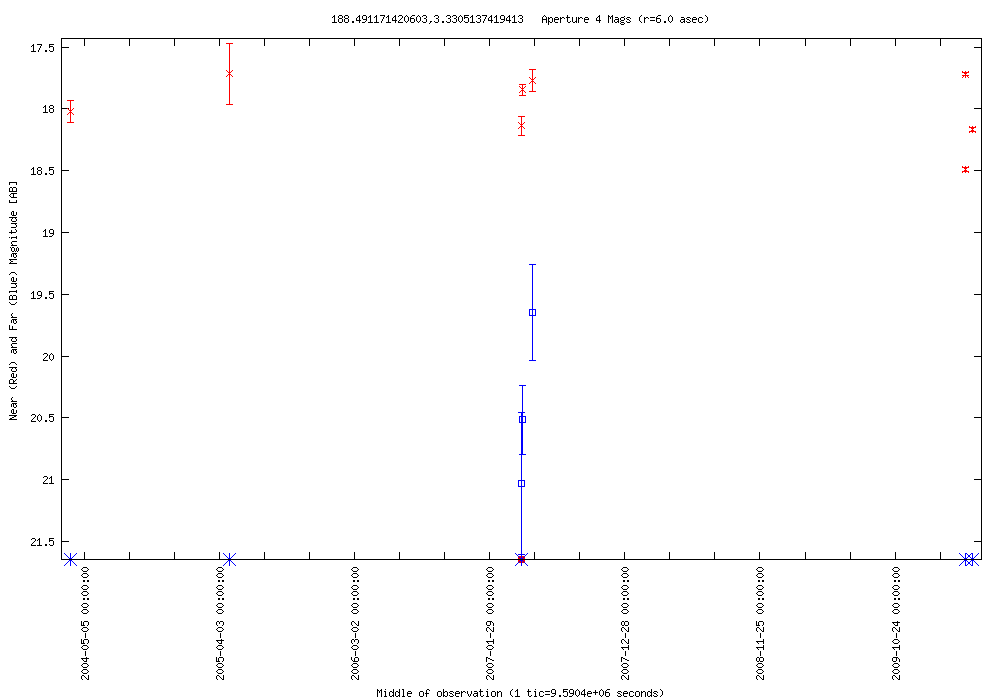
| 2010-05-02 19:26:17-07 | 188.49117 +03.33051 | 0.769 | 17.719 | 3 | 0.000 | 0.000 | 0 | RR Lyrae? | SDSS J123357.82+031949.6 | blue star | NED Simbad SDSS |  |
LC Plot |
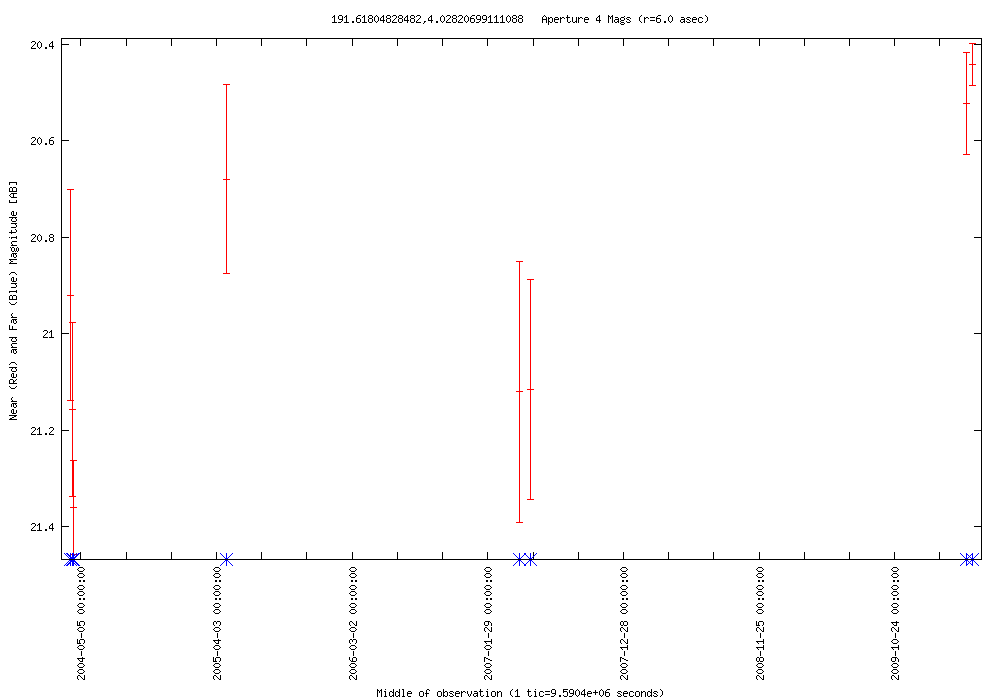
| 2010-05-02 17:47:39-07 | 191.61805 +04.02821 | 0.919 | 20.441 | 4 | 0.000 | 0.000 | 0 | UvES | SDSS J124628.29+040140.9 | blue, stellar | NED Simbad SDSS |  |
LC Plot |
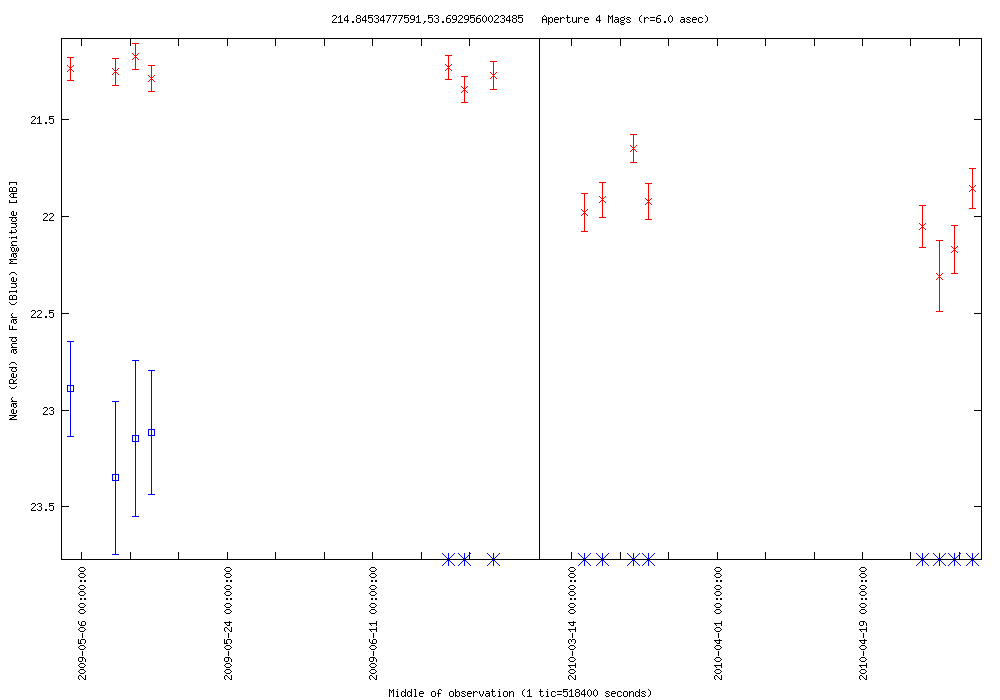
| 2010-05-02 14:30:25-07 | 214.84535 +53.69296 | 1.133 | 21.177 | 15 | 0.458 | 22.891 | 4 | AGN? | SDSS J141922.97+534135.6 | SDSS classified as a star | NED Simbad SDSS |  |
LC Plot |
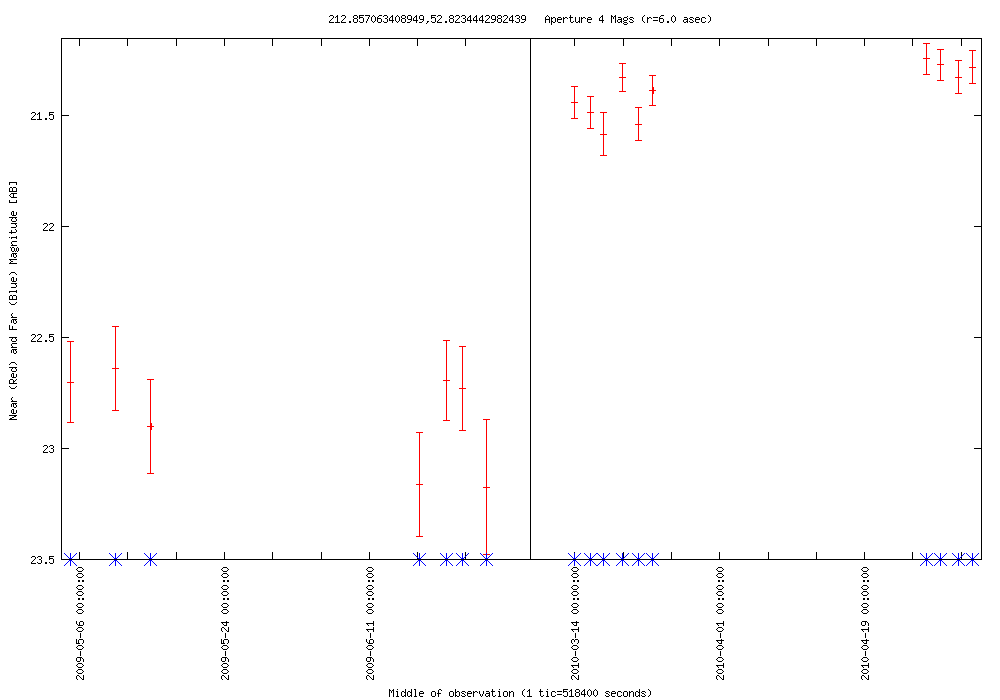
| 2010-05-02 09:34:33-07 | 212.85706 +52.82344 | 1.930 | 21.245 | 17 | 0.000 | 0.000 | 0 | Radio Source, AGN? | SDSS J141125.70+524924.2 | SDSS classified as a galaxy | NED Simbad SDSS |  |
LC Plot |
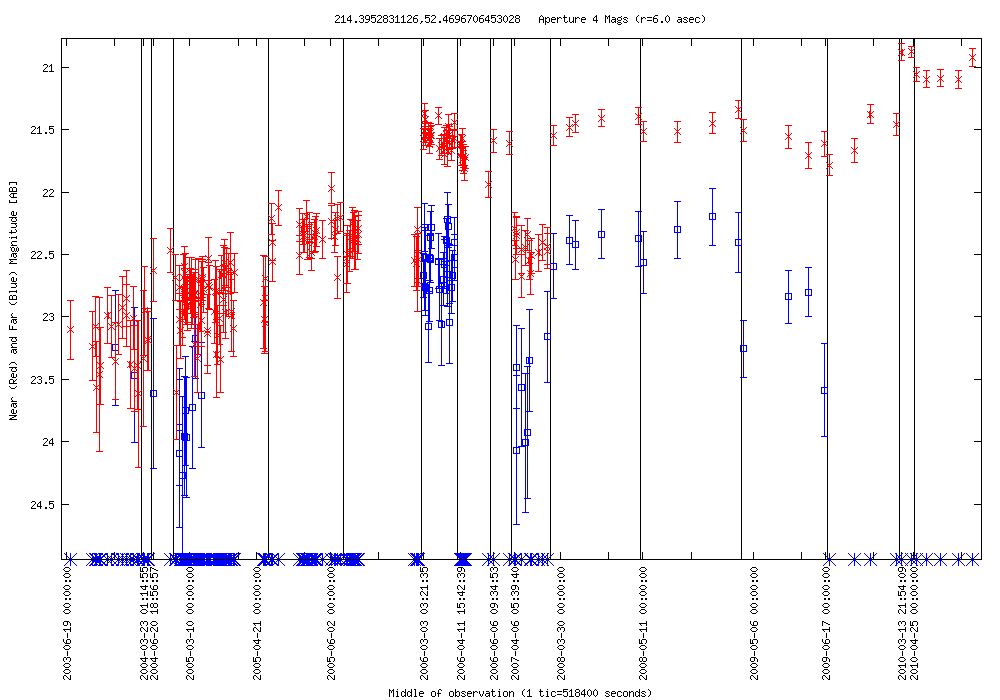
| 2010-05-02 07:55:56-07 | 214.39528 +52.46967 | 2.736 | 20.879 | 211 | 2.073 | 22.196 | 60 | AGN? | SDSS J141734.84+522810.7 | SDSS classified as a star | NED Simbad SDSS |  |
LC Plot |
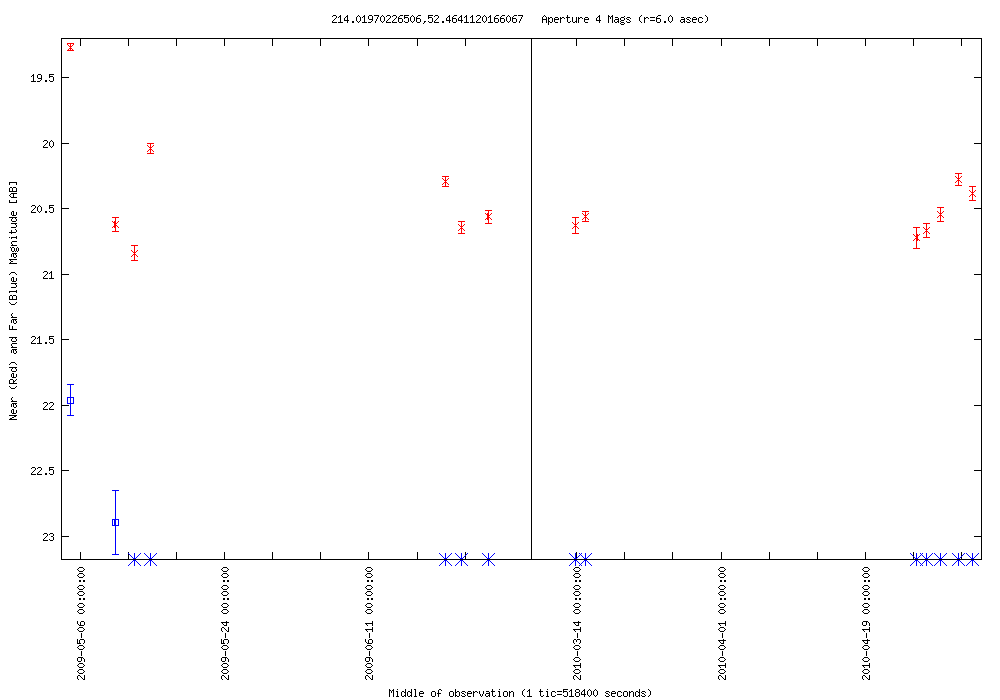
| 2010-05-02 07:55:56-07 | 214.01970 +52.46411 | 1.572 | 19.267 | 14 | 0.932 | 21.962 | 2 | DN? | SDSS J141604.60+522750.0 | caught one eruption | NED Simbad SDSS |  |
LC Plot |
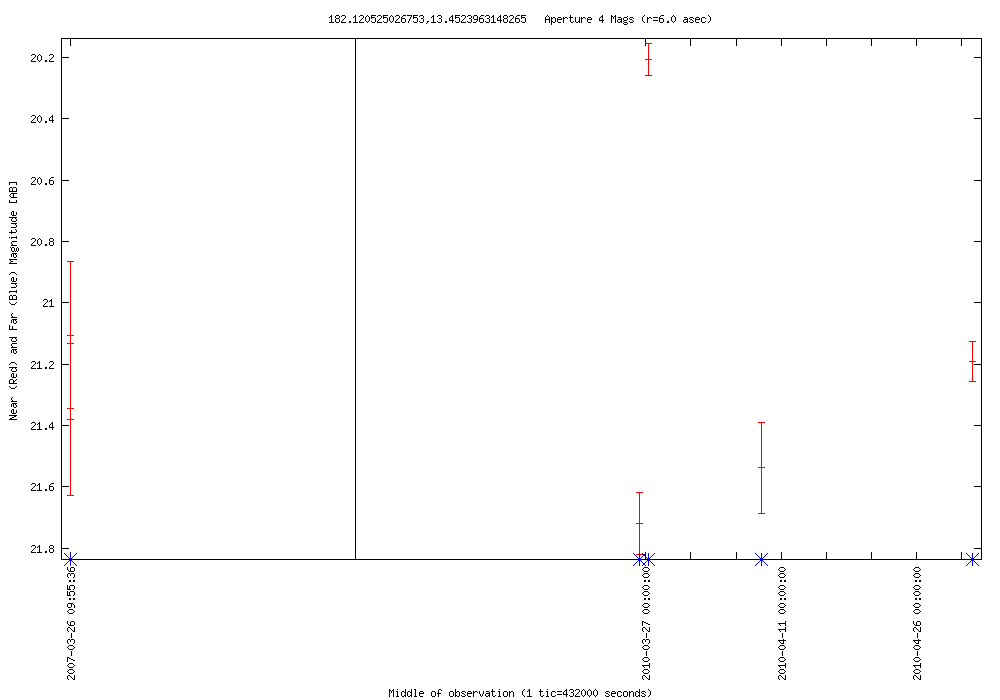
| 2010-05-02 04:38:41-07 | 182.12053 +13.45240 | 1.512 | 20.207 | 4 | 0.000 | 0.000 | 0 | X | [ZEH2003] RX J1208.4+1327 1 | SDSS shows red star | NED Simbad SDSS |  |
LC Plot |
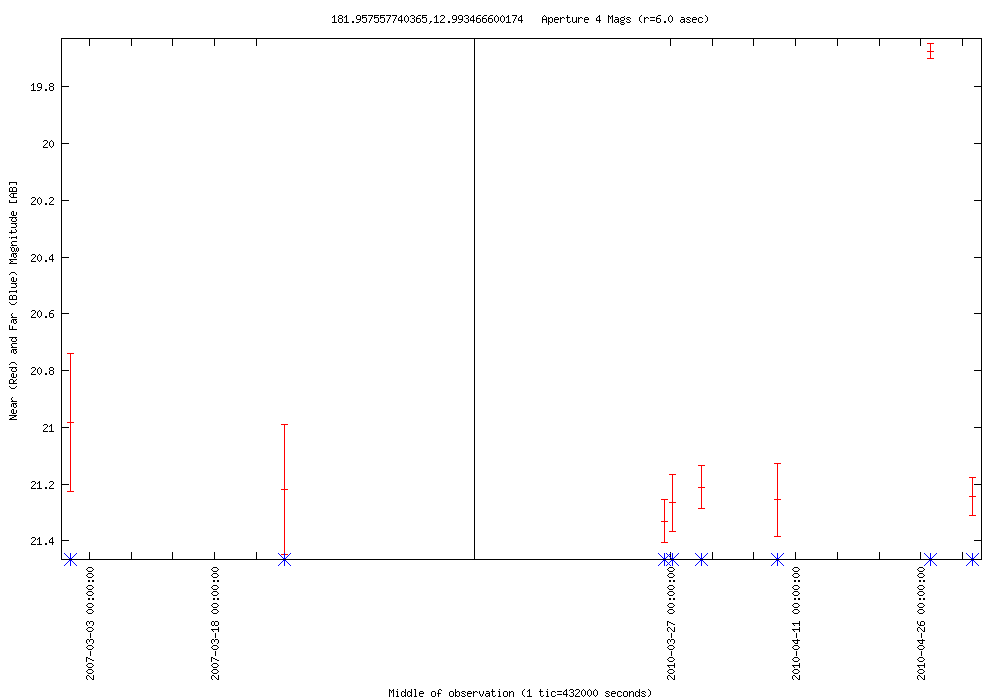
| 2010-05-02 04:38:41-07 | 181.95756 +12.99347 | 1.656 | 19.674 | 6 | 0.000 | 0.000 | 0 | Flare star? | SDSS J120749.74+125937.1 | red star | NED Simbad SDSS |  |
LC Plot |
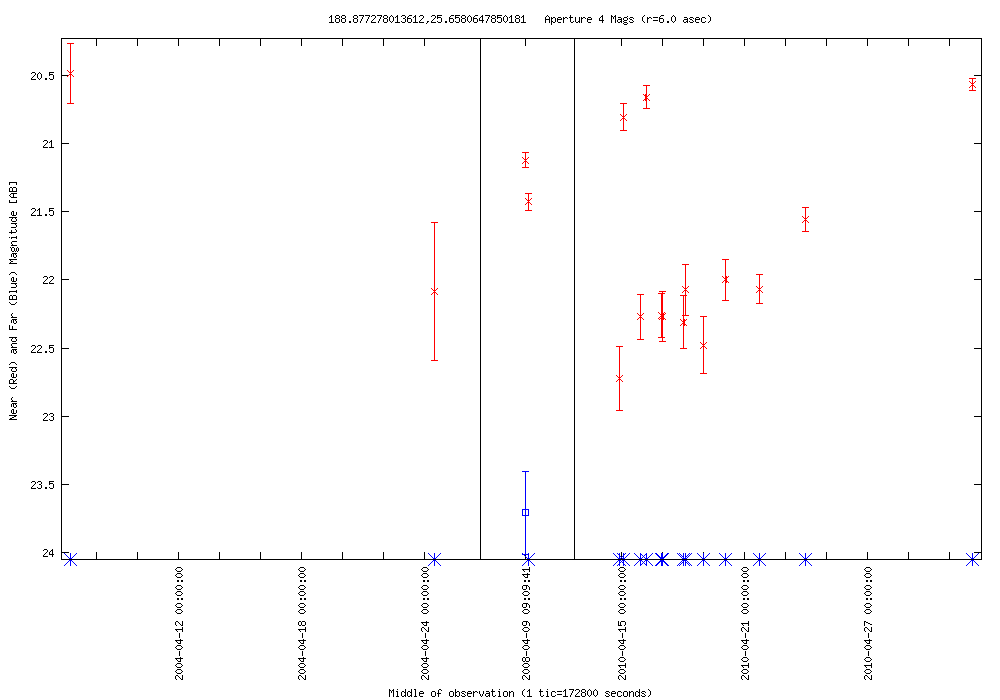
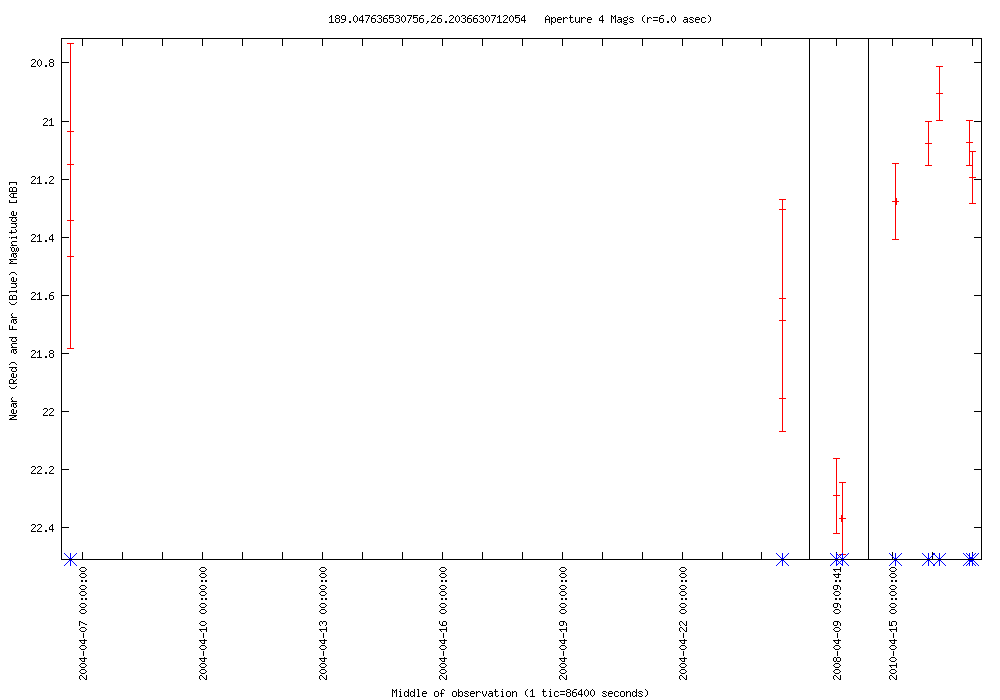
| 2010-05-02 03:00:04-07 | 188.87728 +25.65806 | 2.155 | 20.568 | 15 | 0.000 | 23.707 | 1 | RR Lyrae? | SDSS J123530.51+253928.7 | blue star | NED Simbad SDSS |  |
LC Plot |
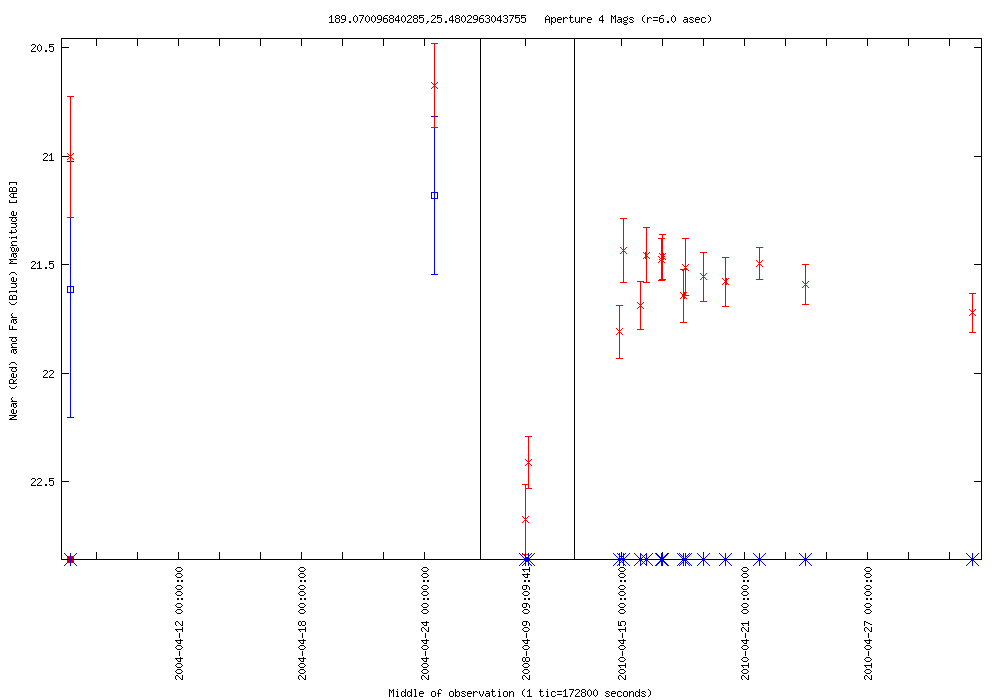
| 2010-05-02 03:00:04-07 | 189.07010 +25.48030 | 1.241 | 21.433 | 15 | 0.000 | 0.000 | 0 | AGN? | SDSS J123616.81+252849.3 | SDSS classified as a star | NED Simbad SDSS |  |
LC Plot |
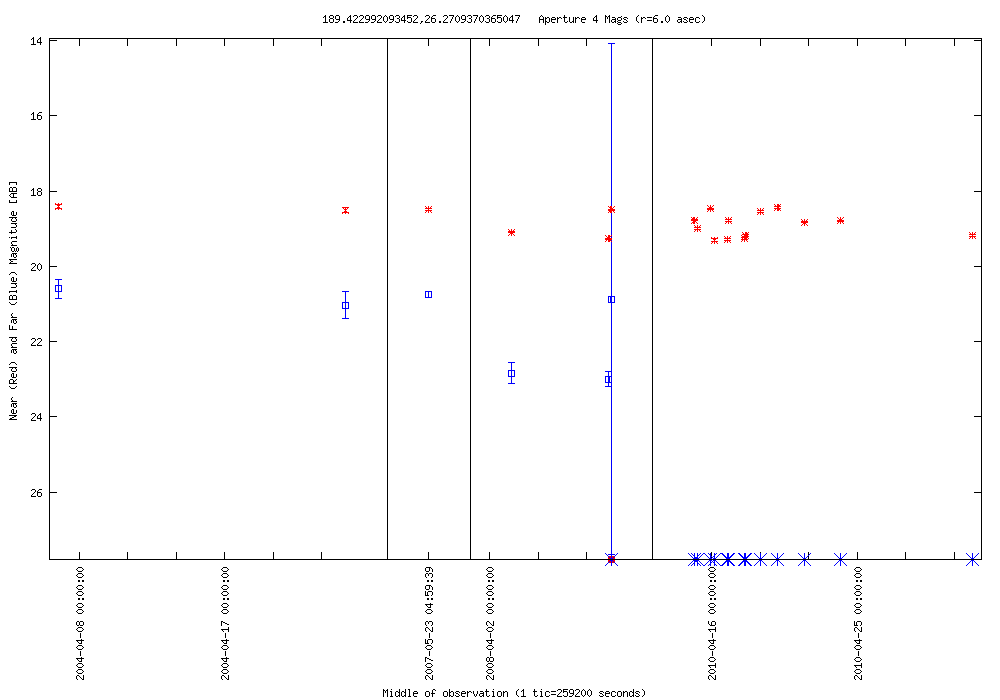
| 2010-05-02 03:00:04-07 | 189.42299 +26.27094 | 0.870 | 18.441 | 17 | 2.249 | 20.747 | 4 | RR Lyrae? | SDSS J123741.44+261615.2 | blue star | NED Simbad SDSS |  |
LC Plot |
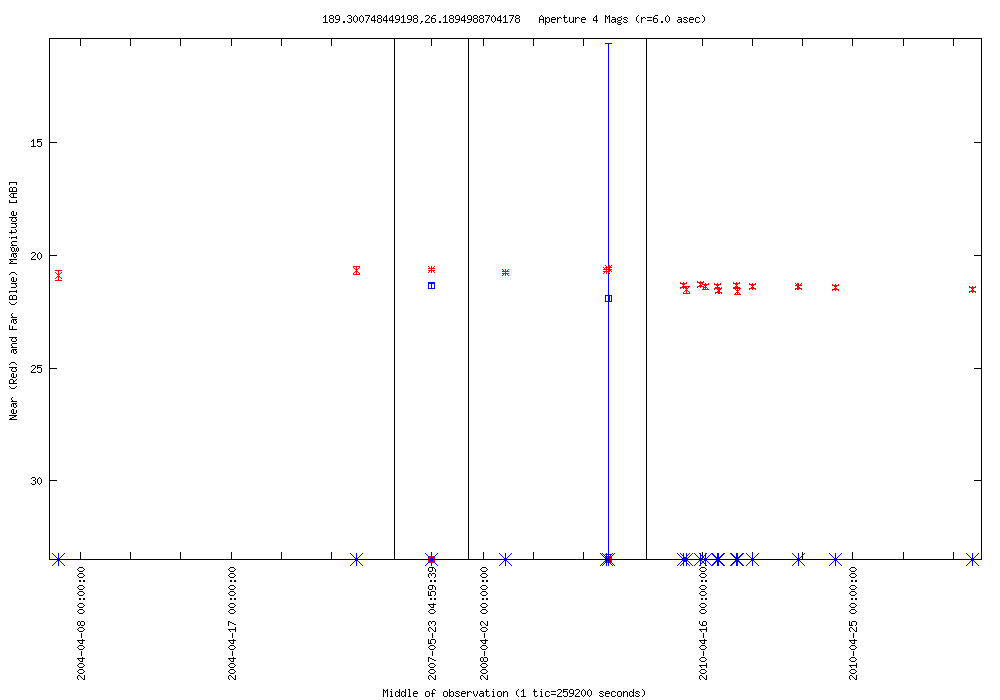
| 2010-05-02 03:00:04-07 | 189.30075 +26.18950 | 1.022 | 20.559 | 16 | 0.000 | 21.332 | 1 | AGN? | SDSS J123712.11+261122.3 | SDSS classified as a star | NED Simbad SDSS |  |
LC Plot |
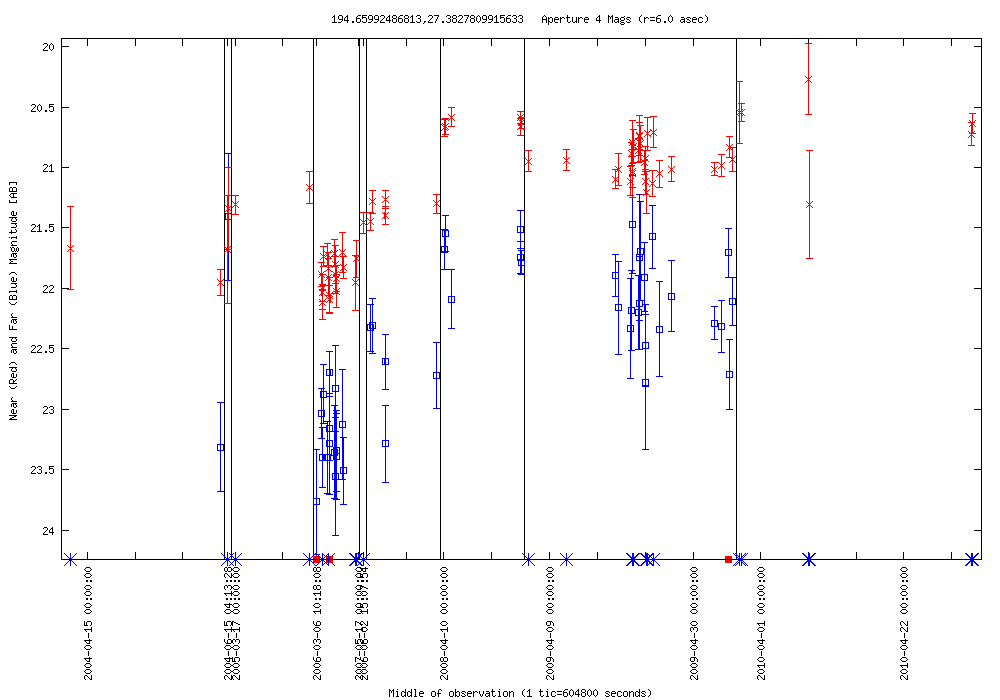
| 2010-05-02 01:21:26-07 | 194.65992 +27.38278 | 1.844 | 20.270 | 67 | 2.289 | 21.474 | 47 | Radio Source | [K94] 125612.98+273913.7 | SDSS J125838.32+272258.2 | NED Simbad SDSS |  |
LC Plot |
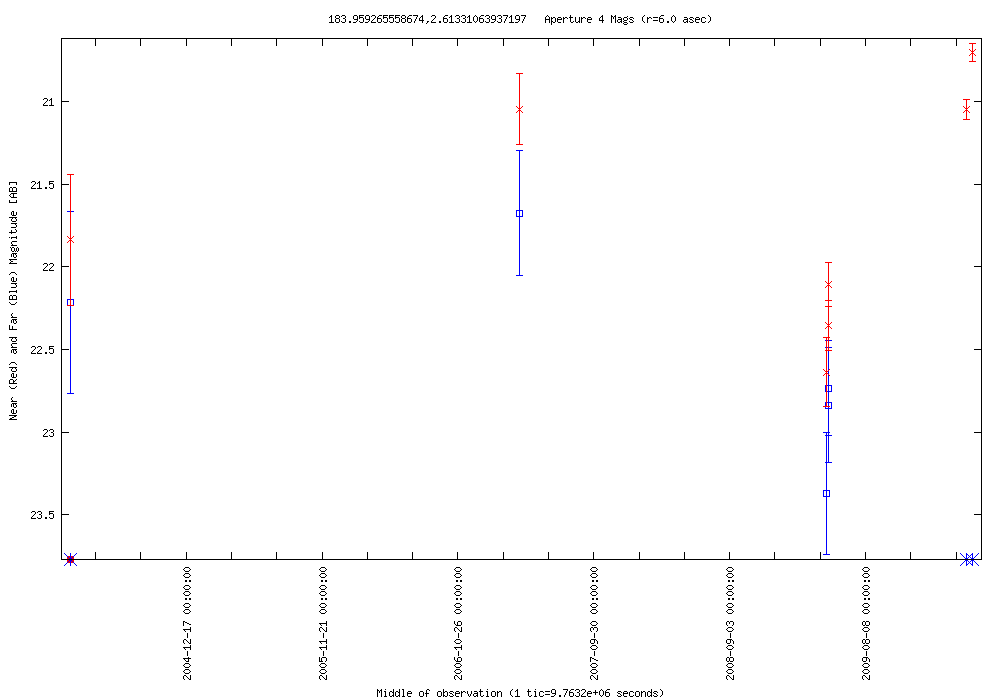
| 2010-05-01 23:42:48-07 | 183.95927 +02.61331 | 1.936 | 20.703 | 4 | 0.637 | 22.734 | 3 | AGN? | SDSS J121550.12+023647.4 | SDSS classified as a star | NED Simbad SDSS |  |
LC Plot |
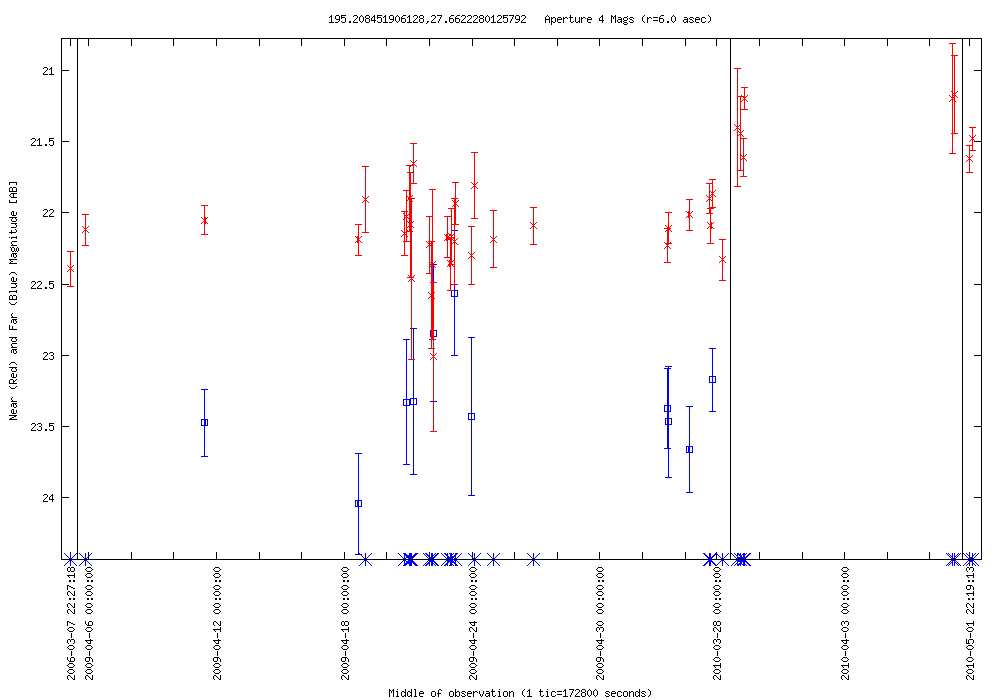
| 2010-05-01 22:04:11-07 | 195.20845 +27.66223 | 1.845 | 21.166 | 36 | 1.481 | 22.564 | 9 | AGN? | SDSS J130050.00+273943.4 | SDSS classified as a galaxy | NED Simbad SDSS |  |
LC Plot |
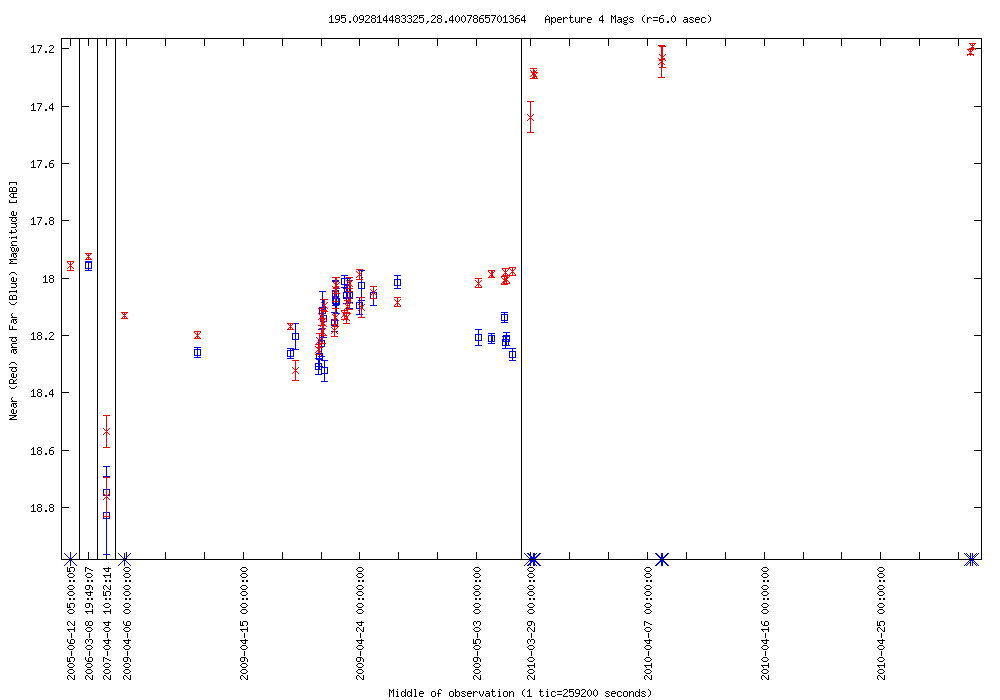
| 2010-05-01 22:04:11-07 | 195.09281 +28.40079 | 1.131 | 17.191 | 36 | 0.367 | 17.957 | 28 | QSO | X Com | z=0.09 | NED Simbad SDSS |  |
LC Plot |
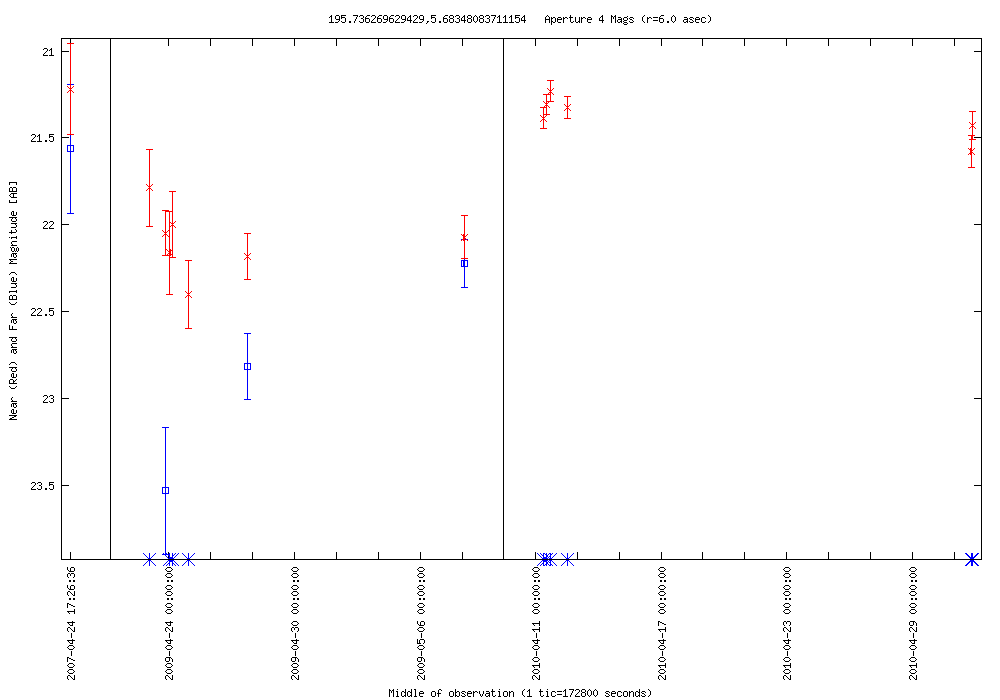
| 2010-05-01 18:46:56-07 | 195.73627 +05.68348 | 1.171 | 21.232 | 13 | 1.306 | 22.223 | 3 | UvES | SDSS J130256.67+054100.4 | SDSS classified as a star | NED Simbad SDSS |  |
LC Plot |
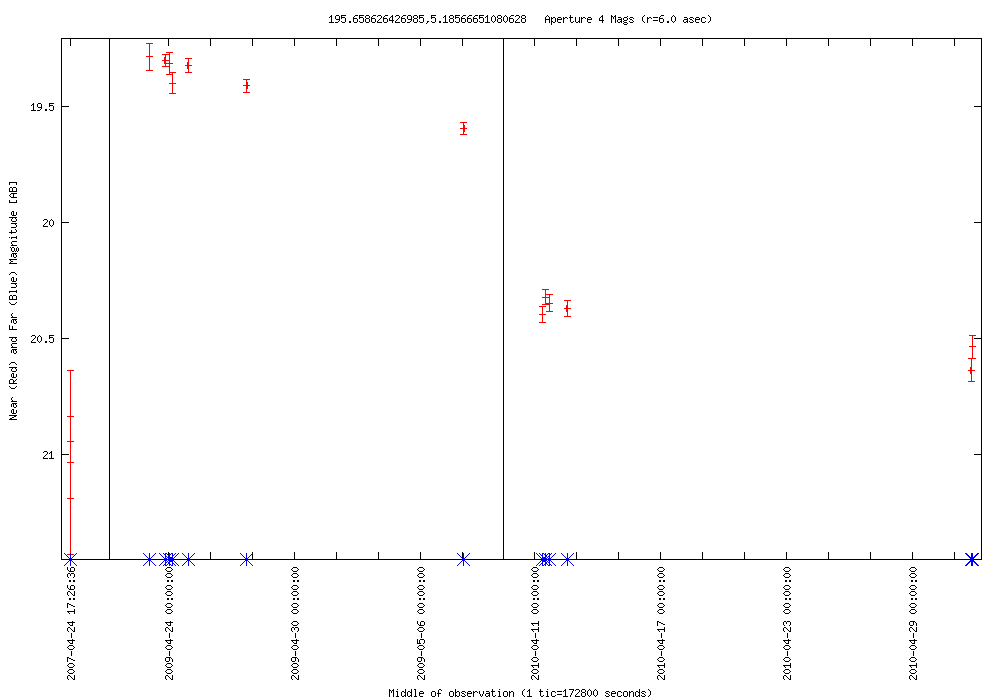
| 2010-05-01 18:46:56-07 | 195.65863 +05.18567 | 1.353 | 19.284 | 13 | 0.000 | 0.000 | 0 | Semi-regular pulsator | RT Vir | SDSS shows bright, red star | NED Simbad SDSS |  |
LC Plot |
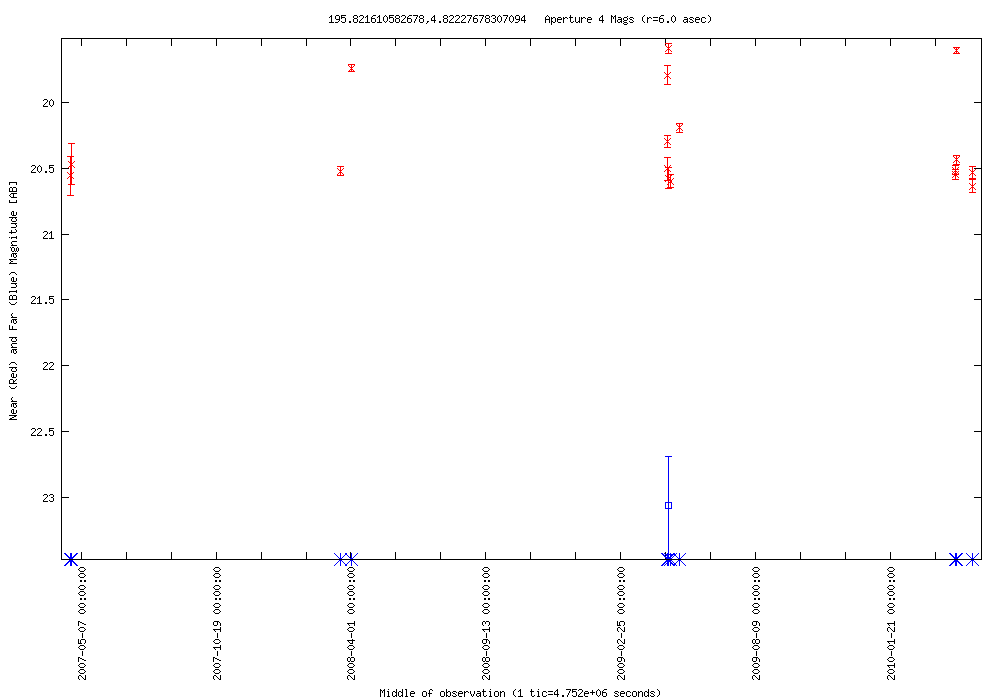
| 2010-05-01 18:46:56-07 | 195.82161 +04.82228 | 1.048 | 19.587 | 15 | 0.000 | 23.061 | 1 | RR Lyrae? | SDSS J130317.08+044919.3 | blue star | NED Simbad SDSS |  |
LC Plot |
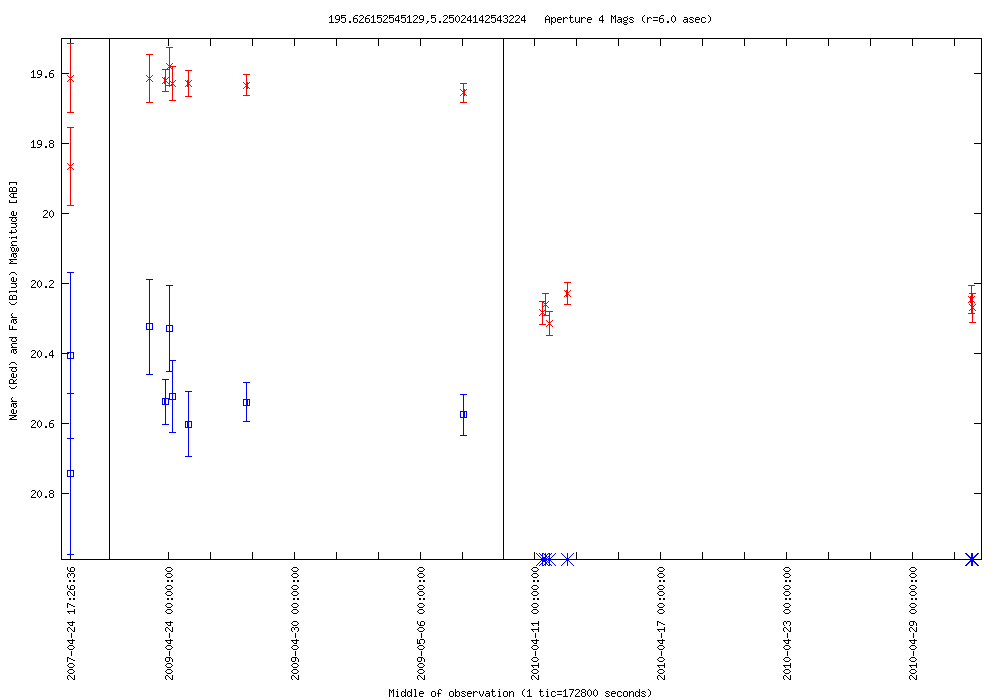
| 2010-05-01 18:46:56-07 | 195.62615 +05.25024 | 0.734 | 19.580 | 13 | 0.278 | 20.325 | 7 | UvES | SDSS J130230.20+051502.0 | SDSS classified as a star | NED Simbad SDSS |  |
LC Plot |
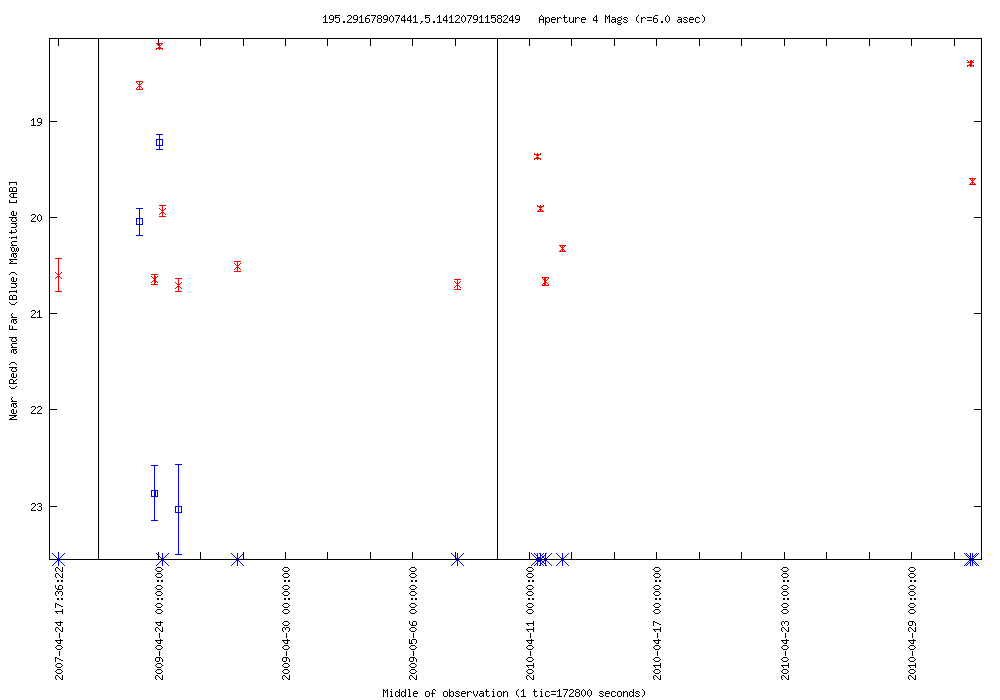
| 2010-05-01 18:46:56-07 | 195.29168 +05.14121 | 2.483 | 18.222 | 13 | 3.817 | 19.218 | 4 | Flare star? | SDSS J130109.93+050828.5 | dropped 2+ mags in 22 hr | NED Simbad SDSS |  |
LC Plot |
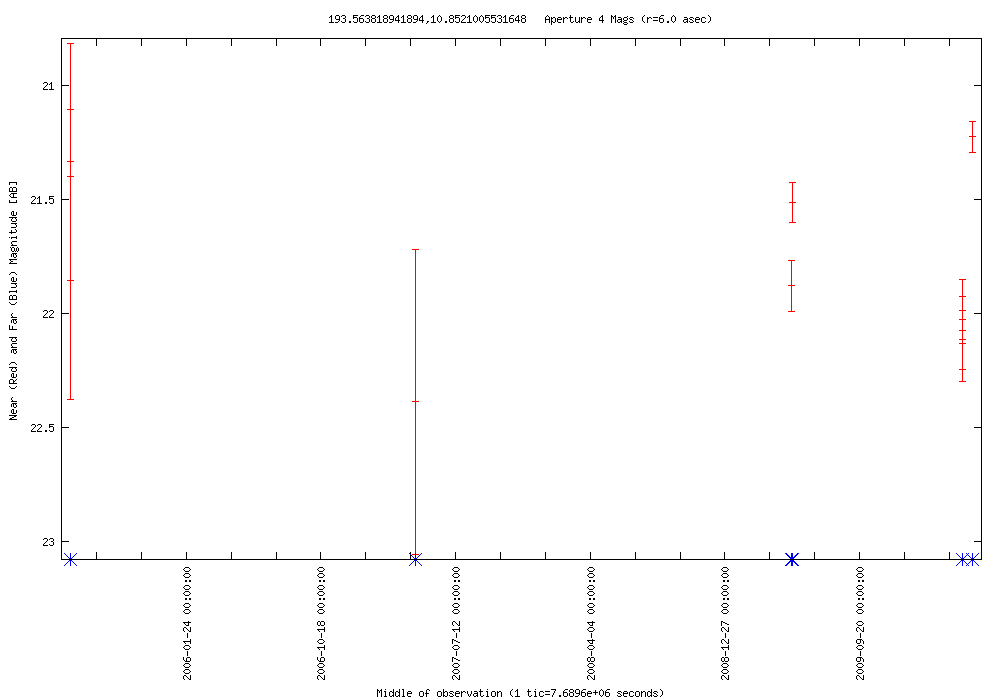
| 2010-05-01 17:08:18-07 | 193.56382 +10.85210 | 0.890 | 21.228 | 6 | 0.000 | 0.000 | 0 | AGN? | SDSS J125415.18+105107.2 | blue, stellar | NED Simbad SDSS |  |
LC Plot |
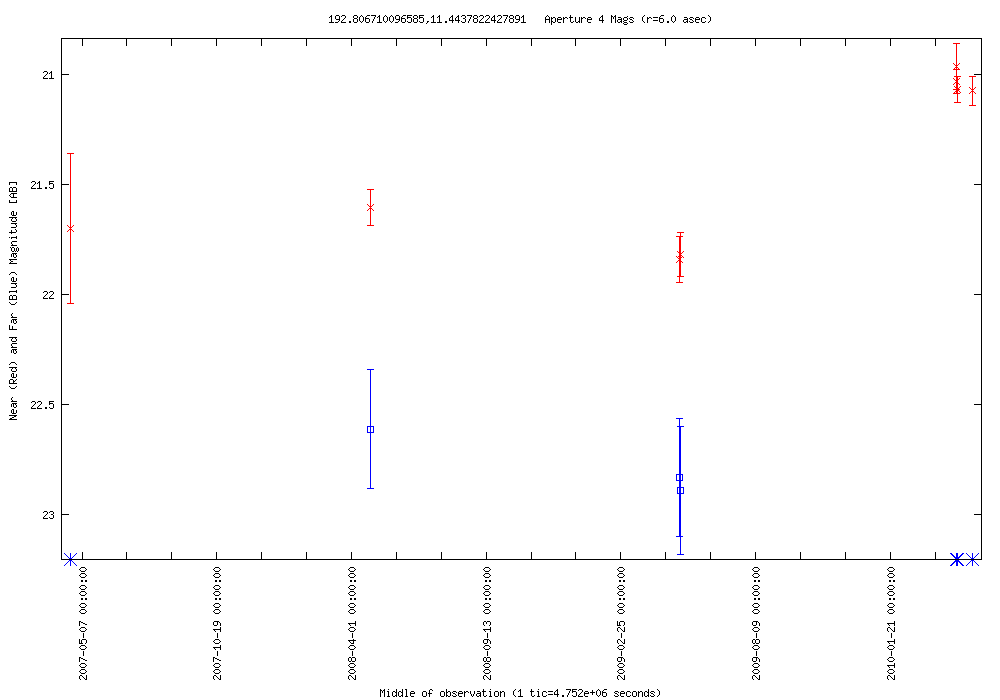
| 2010-05-01 17:08:18-07 | 192.80671 +11.44378 | 0.876 | 20.966 | 6 | 0.058 | 22.833 | 2 | AGN? | SDSS J125113.49+112636.5 | SDSS classified as a star | NED Simbad SDSS |  |
LC Plot |
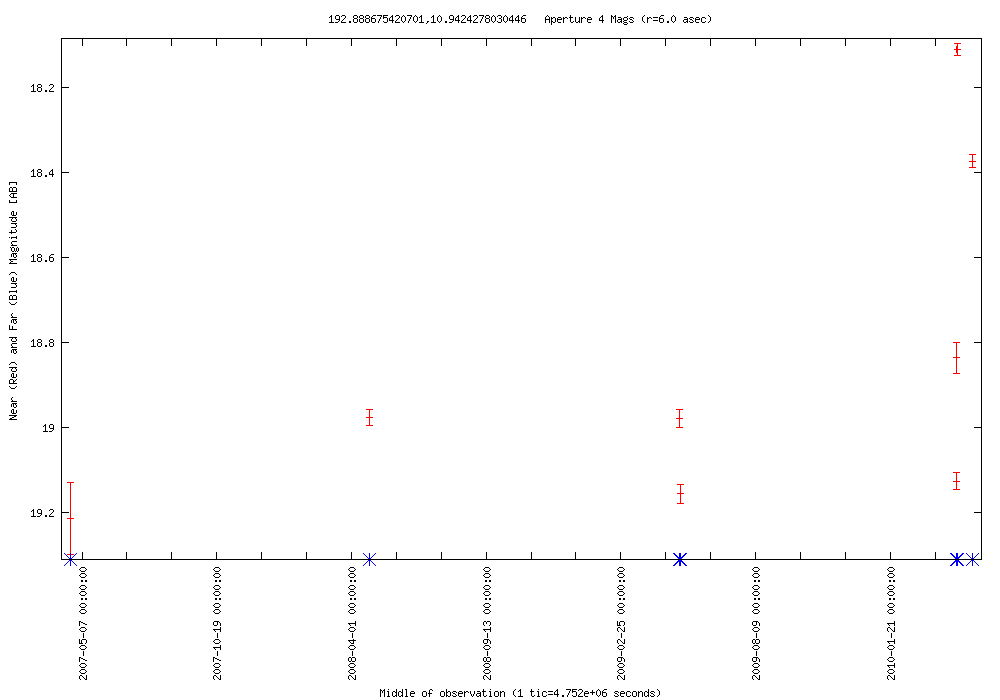
| 2010-05-01 17:08:18-07 | 192.88868 +10.94243 | 1.046 | 18.110 | 7 | 0.000 | 0.000 | 0 | RR Lyrae? | SDSS J125133.23+105633.1 | blue star | NED Simbad SDSS |  |
LC Plot |
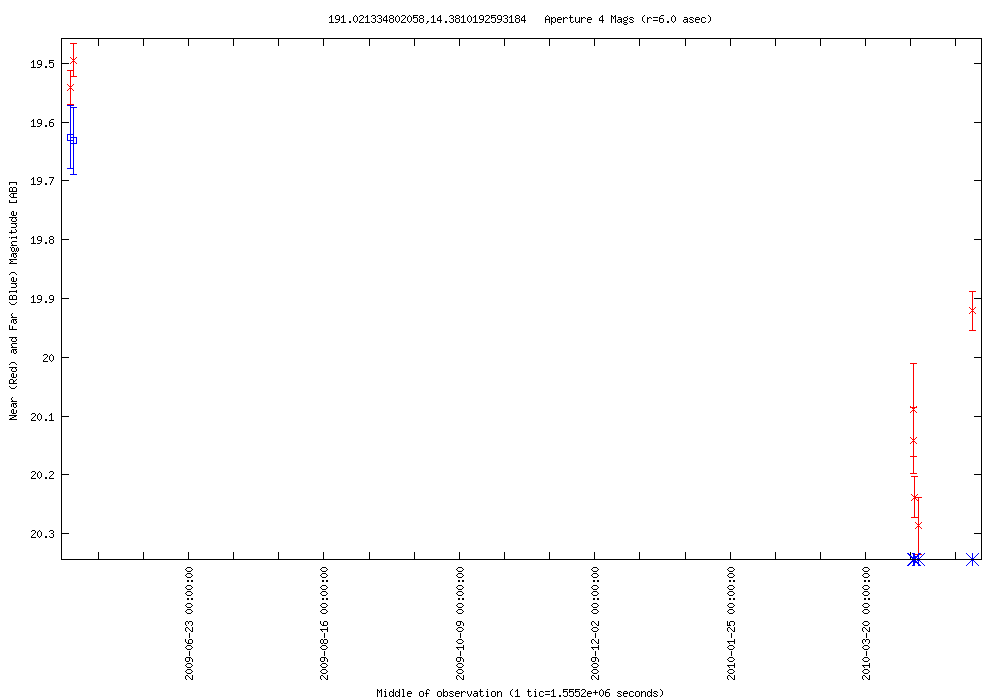
| 2010-05-01 15:29:40-07 | 191.02133 +14.38102 | 0.792 | 19.494 | 7 | 0.006 | 19.626 | 2 | Sy 1 | 2MASX J12440523+1422516 | z=0.15 aka SDSS J124405.20+142251.5 | NED Simbad SDSS |  |
LC Plot |
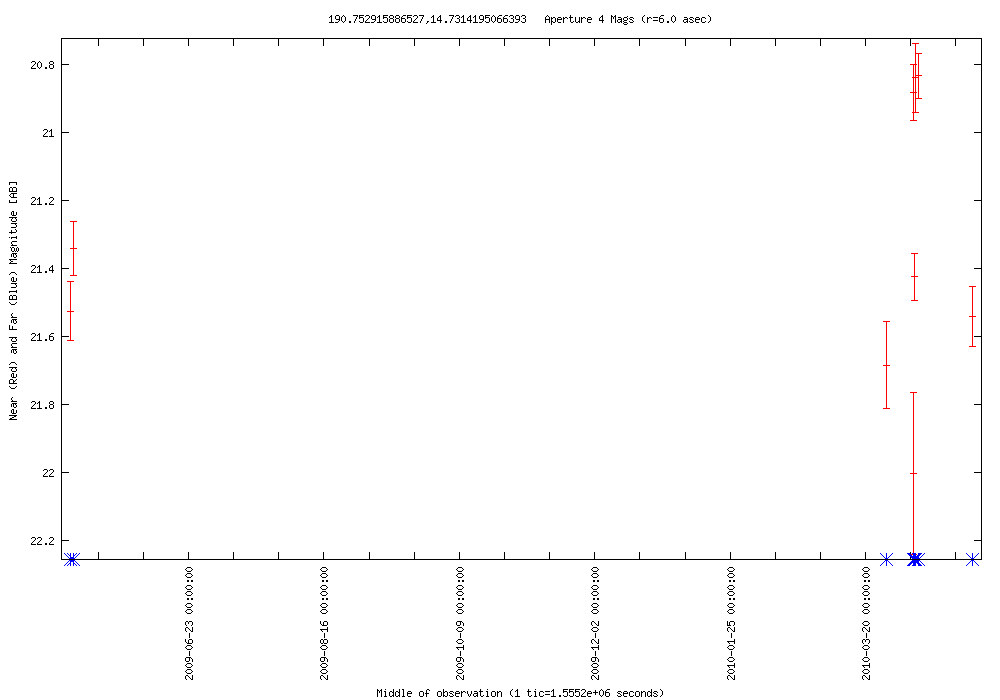
| 2010-05-01 15:29:40-07 | 190.75292 +14.73142 | 1.168 | 20.834 | 7 | 0.000 | 0.000 | 0 | RR Lyrae? | SDSS J124300.68+144352.3 | SDSS classified as a star | NED Simbad SDSS |  |
LC Plot |
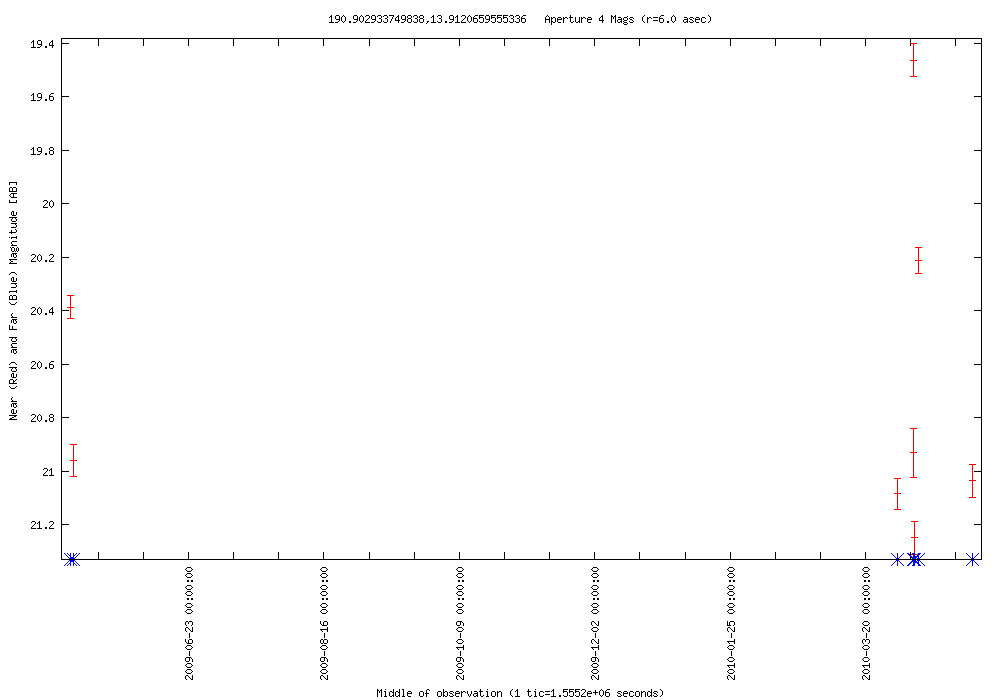
| 2010-05-01 15:29:40-07 | 190.90293 +13.91207 | 1.784 | 19.464 | 8 | 0.000 | 0.000 | 0 | AGN? | SDSS J124336.65+135443.6 | SDSS classified as a star | NED Simbad SDSS |  |
LC Plot |
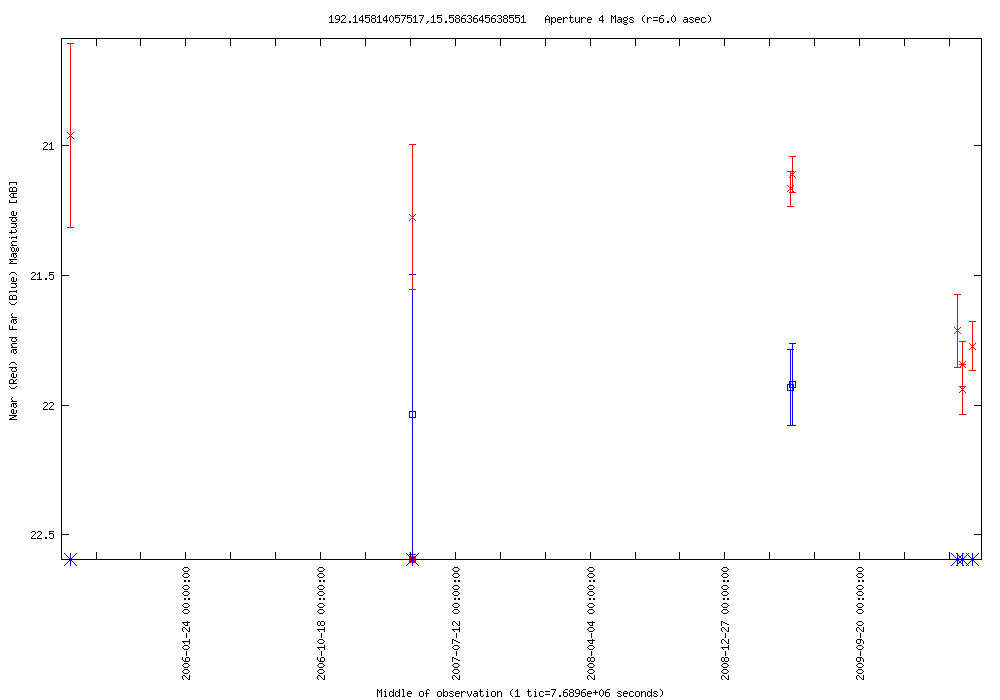
| 2010-05-01 13:51:02-07 | 192.14581 +15.58636 | 0.826 | 21.114 | 6 | 0.011 | 21.921 | 2 | AGN? | SDSS J124834.94+153509.9 | SDSS classified as a star | NED Simbad SDSS |  |
LC Plot |
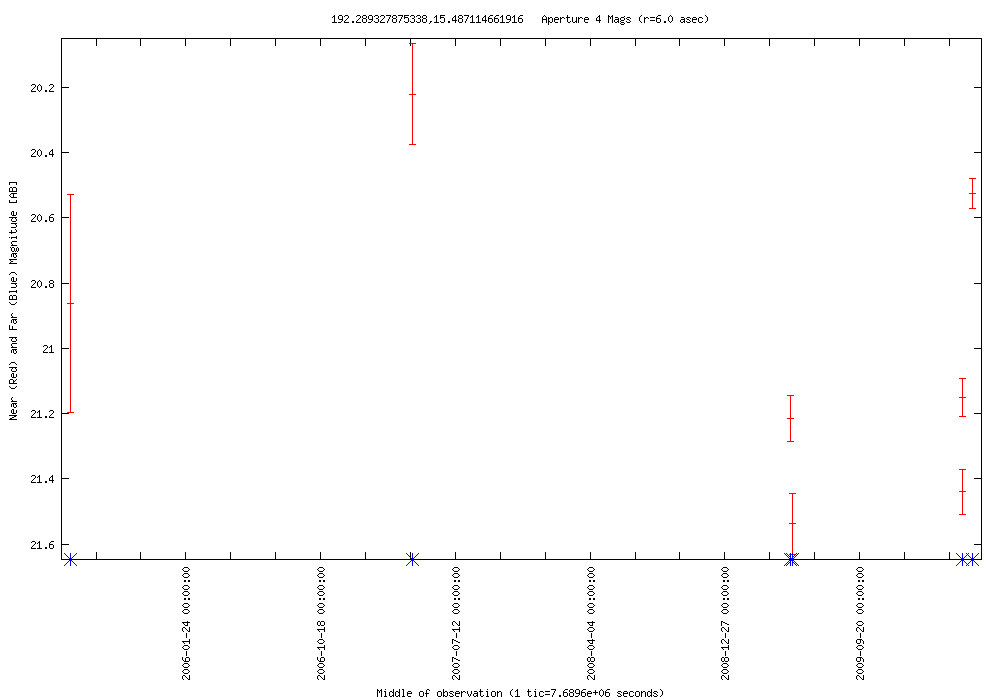
| 2010-05-01 13:51:02-07 | 192.28933 +15.48711 | 1.013 | 20.525 | 5 | 0.000 | 0.000 | 0 | AGN? | SDSS J124909.39+152912.8 | blue, stellar | NED Simbad SDSS |  |
LC Plot |
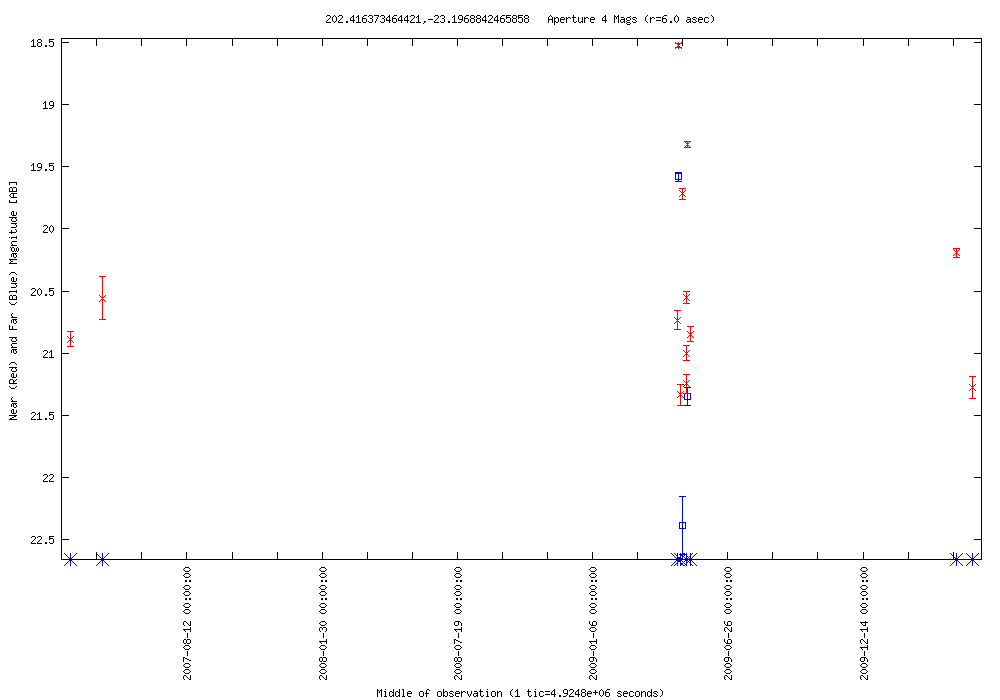
| 2010-05-01 08:55:09-07 | 202.41637 --23.19688 | 2.804 | 18.528 | 12 | 2.804 | 19.580 | 3 | RR Lyrae? | - | blue star | NED Simbad SDSS |  |
LC Plot |
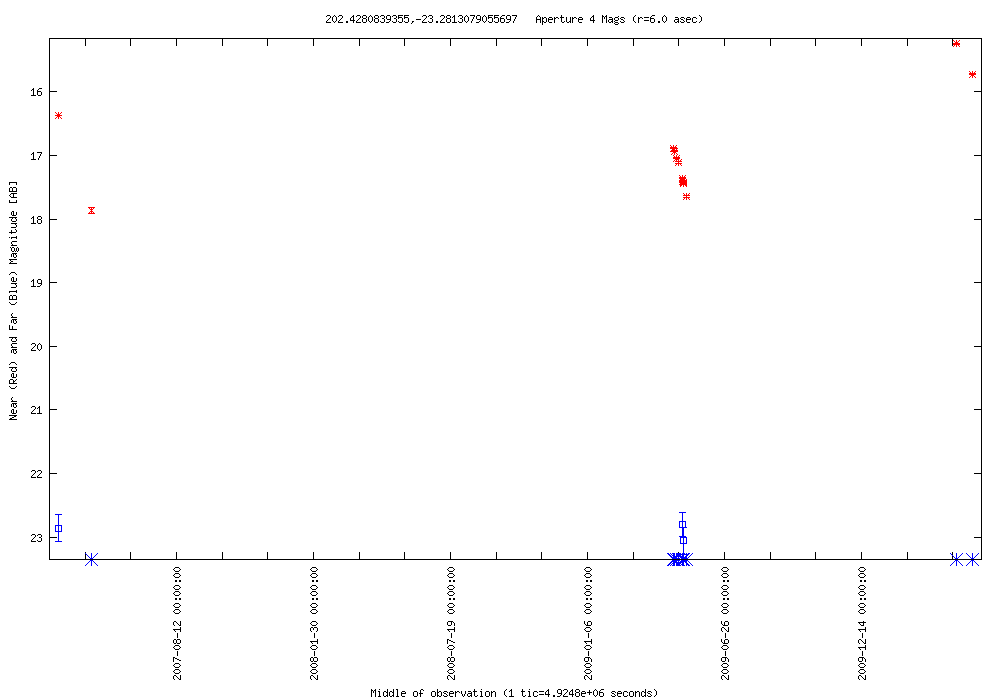
| 2010-05-01 08:55:09-07 | 202.42808 --23.28131 | 2.398 | 15.244 | 12 | 0.256 | 22.800 | 3 | Mira | R Hya | Bright | NED Simbad SDSS |  |
LC Plot |
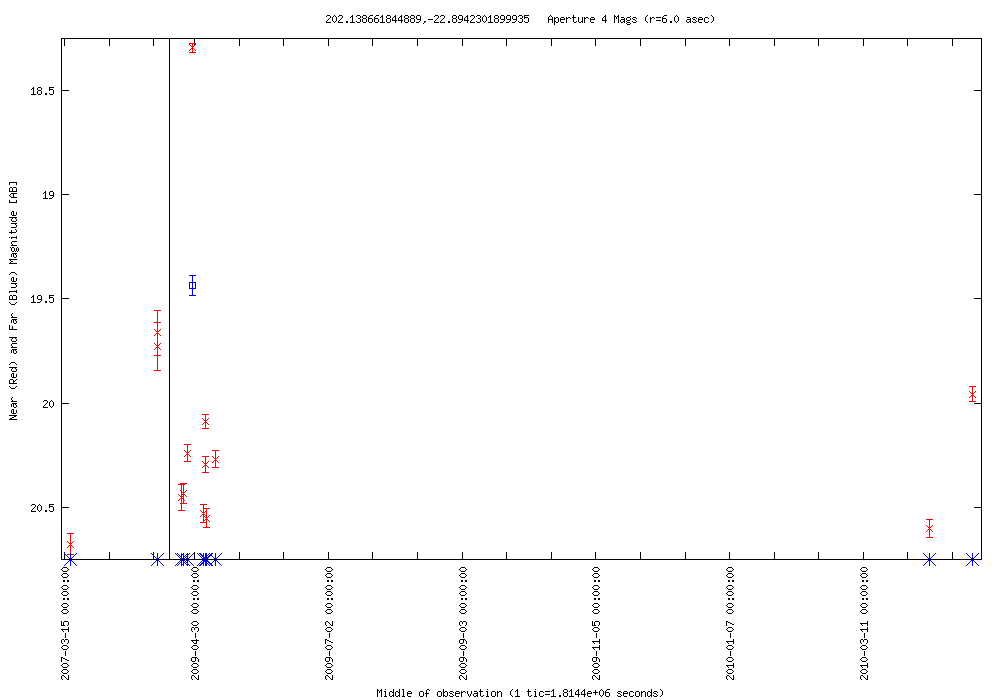
| 2010-05-01 08:55:09-07 | 202.13866 --22.89423 | 2.379 | 18.297 | 12 | 0.000 | 19.436 | 1 | HB star | HE 1325-2238 | RR Lyrae? | NED Simbad SDSS |  |
LC Plot |
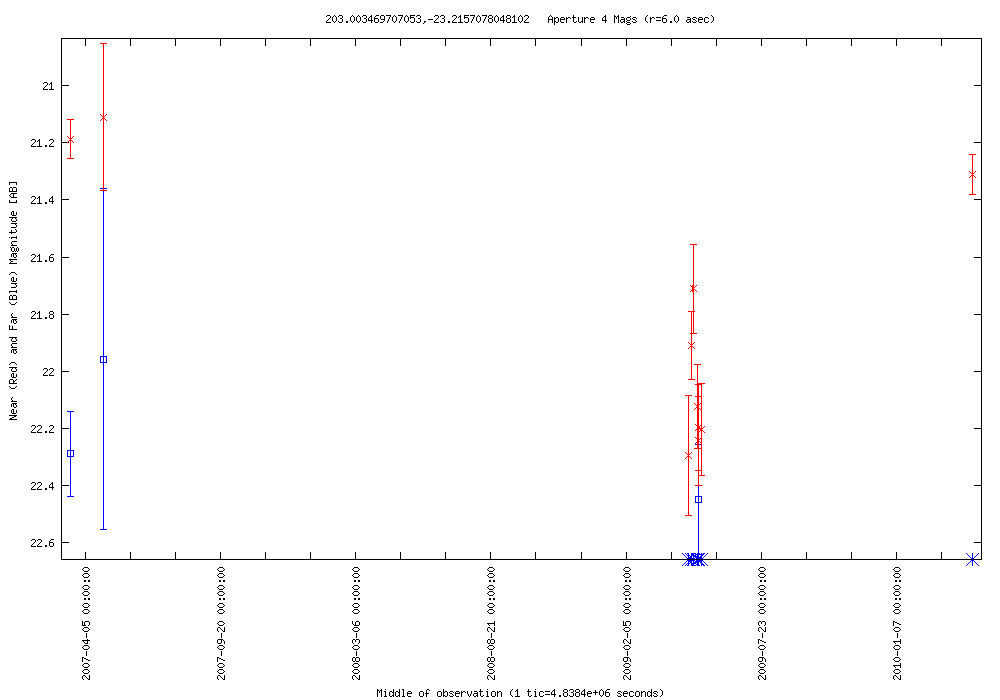
| 2010-05-01 08:55:09-07 | 203.00347 --23.21571 | 1.110 | 21.184 | 11 | 0.000 | 22.447 | 1 | AGN? | - | blue star | NED Simbad SDSS |  |
LC Plot |
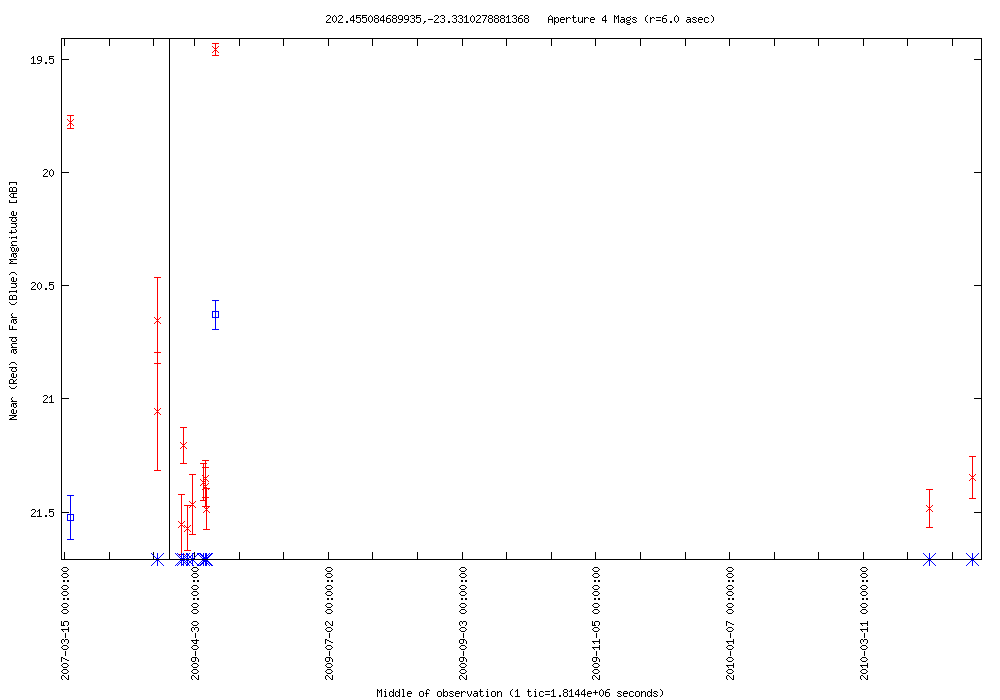
| 2010-05-01 08:55:09-07 | 202.45508 --23.33103 | 2.114 | 19.457 | 12 | 0.897 | 20.628 | 2 | DN? | - | blue star | NED Simbad SDSS |  |
LC Plot |
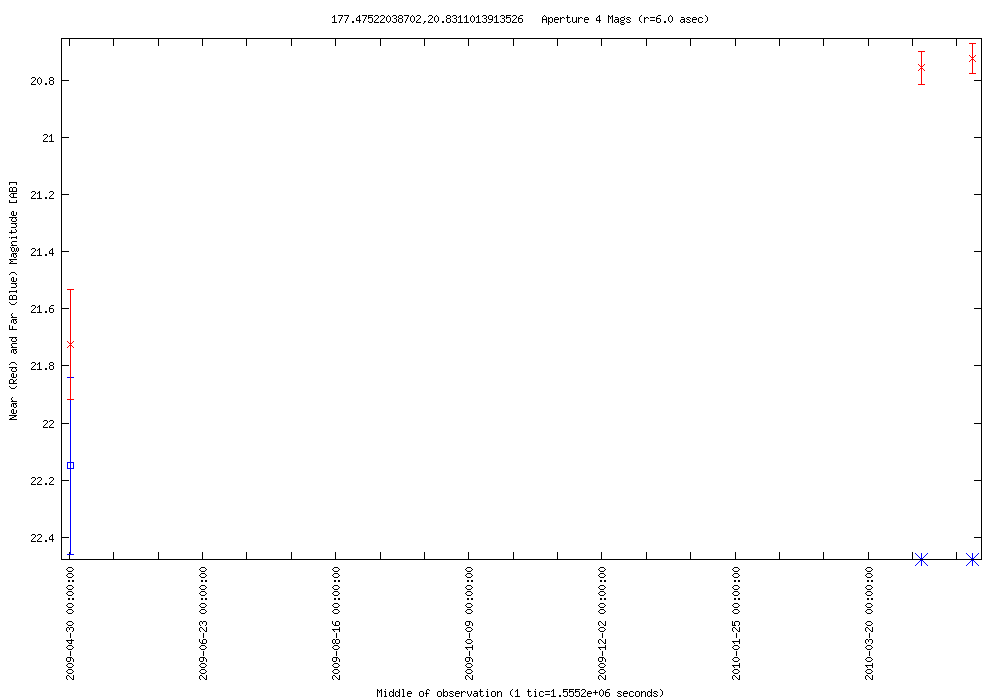
| 2010-05-01 07:16:31-07 | 177.47522 +20.83110 | 1.002 | 20.724 | 3 | 0.000 | 22.149 | 1 | AGN? | SDSS J114953.94+204952.0 | SDSS classified as a galaxy | NED Simbad SDSS |  |
LC Plot |
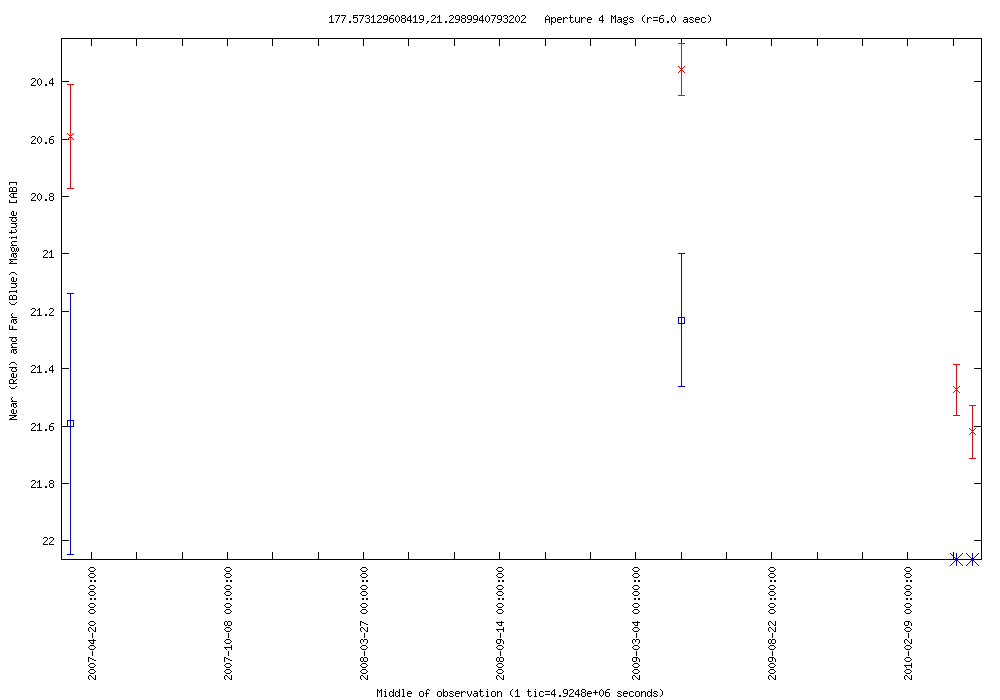
| 2010-05-01 07:16:31-07 | 177.57313 +21.29899 | 1.263 | 20.358 | 3 | 0.000 | 21.230 | 1 | AGN? | SDSS J115017.53+211755.8 | SDSS classified as a galaxy | NED Simbad SDSS |  |
LC Plot |
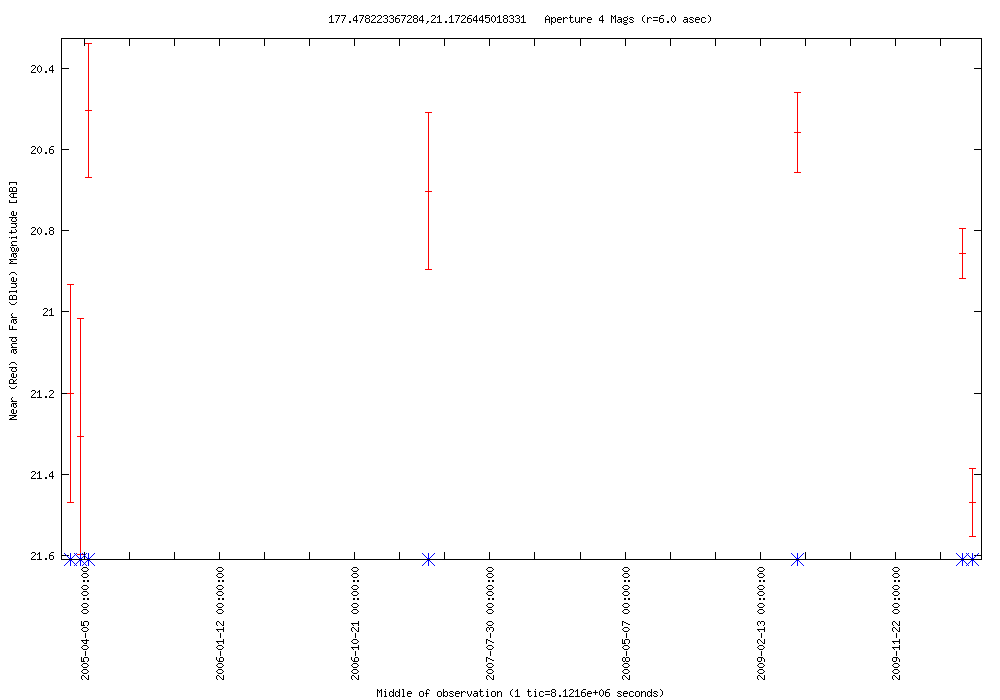
| 2010-05-01 07:16:31-07 | 177.47822 +21.17264 | 0.910 | 20.559 | 3 | 0.000 | 0.000 | 0 | AGN? | SDSS J114954.69+211021.0 | blue, stellar | NED Simbad SDSS |  |
LC Plot |
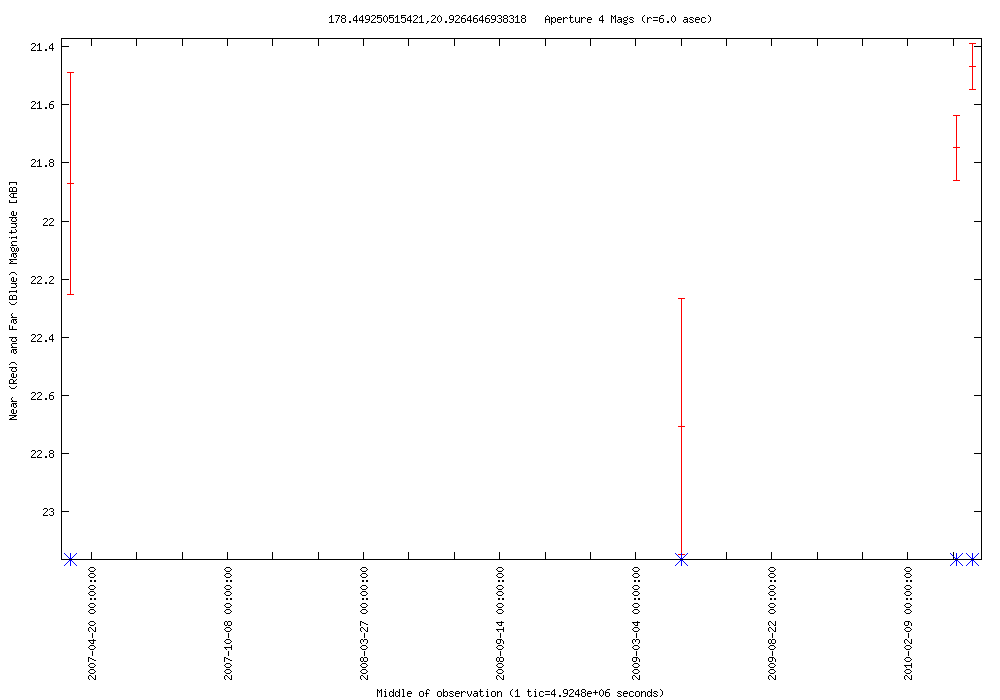
| 2010-05-01 07:16:31-07 | 178.44925 +20.92646 | 1.237 | 21.469 | 3 | 0.000 | 0.000 | 0 | AGN? | SDSS J115347.82+205534.8 | SDSS classified as a galaxy | NED Simbad SDSS |  |
LC Plot |
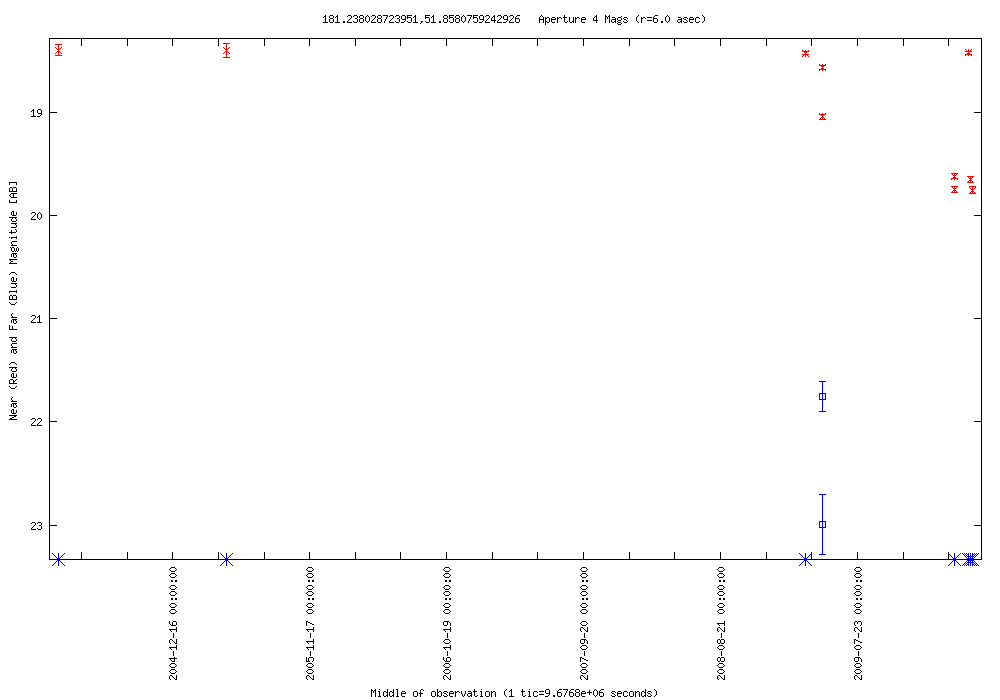
| 2010-05-01 02:20:37-07 | 181.23803 +51.85808 | 1.331 | 18.426 | 8 | 1.242 | 21.752 | 2 | AGN? | SDSS J120457.15+515129.1 | SDSS classified as a star | NED Simbad SDSS |  |
LC Plot |
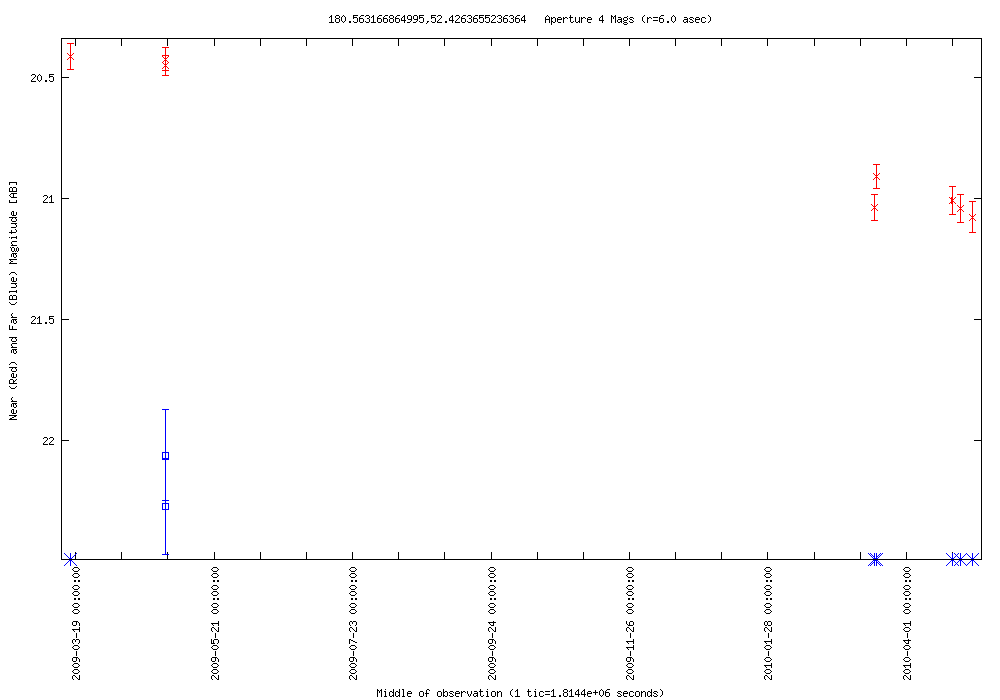
| 2010-05-01 02:20:37-07 | 180.56317 +52.42637 | 0.664 | 20.413 | 8 | 0.213 | 22.059 | 2 | AGN? | SDSS J120215.07+522534.7 | SDSS classified as a star | NED Simbad SDSS |  |
LC Plot |
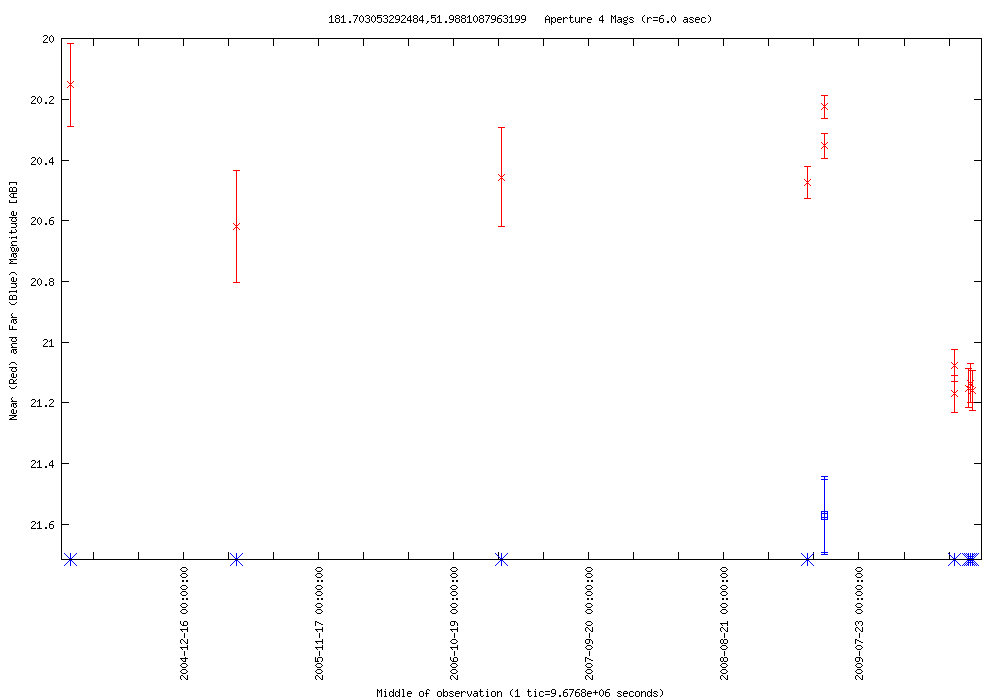
| 2010-05-01 02:20:37-07 | 181.70305 +51.98811 | 0.946 | 20.225 | 8 | 0.006 | 21.569 | 2 | AGN? | SDSS J120648.89+515916.7 | SDSS classified as a star | NED Simbad SDSS |  |
LC Plot |
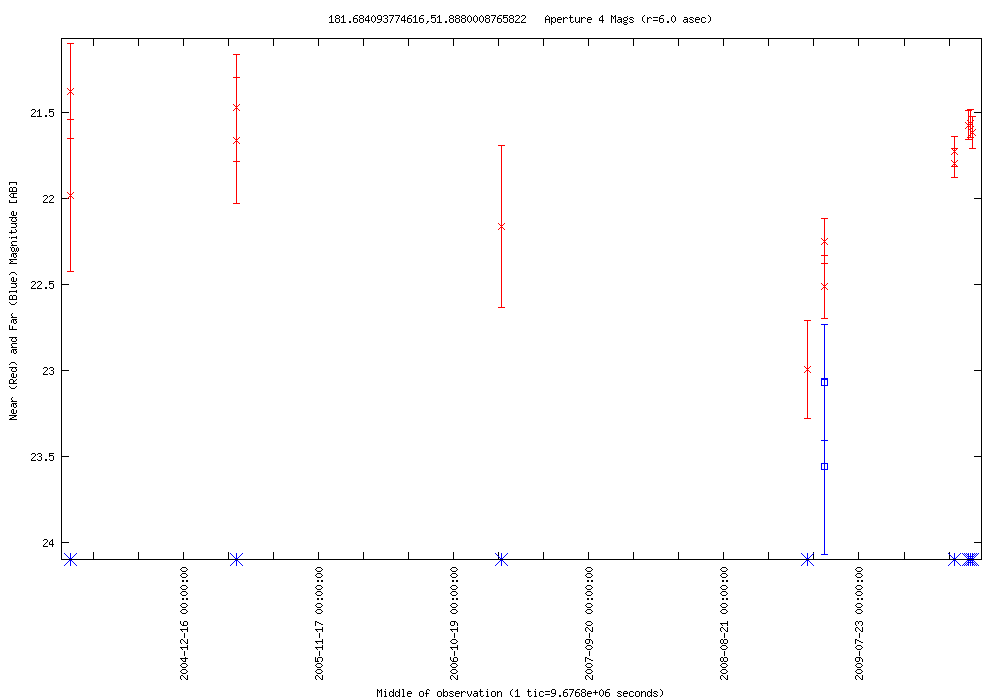
| 2010-05-01 02:20:37-07 | 181.68409 +51.88800 | 1.432 | 21.565 | 8 | 0.488 | 23.073 | 2 | QSO | SDSS J120644.18+515316.1 | z=2.23 | NED Simbad SDSS |  |
LC Plot |
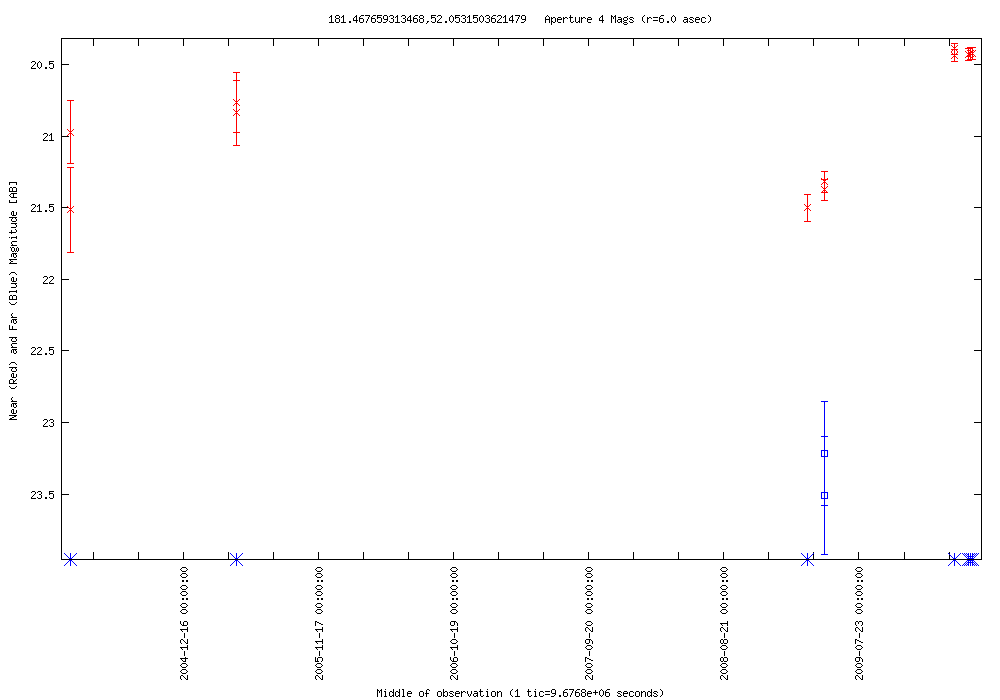
| 2010-05-01 02:20:37-07 | 181.46766 +52.05315 | 1.110 | 20.391 | 8 | 0.293 | 23.217 | 2 | AGN? | SDSS J120552.34+520311.0 | SDSS classified as a star | NED Simbad SDSS |  |
LC Plot |
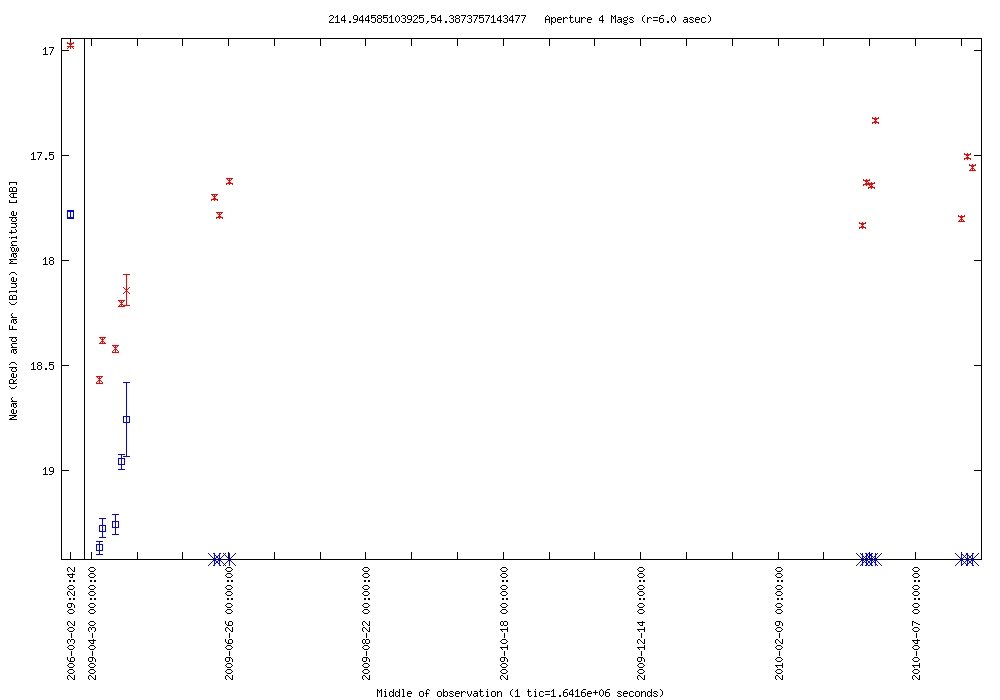
| 2010-04-30 16:28:48-07 | 214.94459 +54.38738 | 1.592 | 16.976 | 16 | 1.586 | 17.784 | 6 | QSO | [HB89] 1418+546 | z=0.15 | NED Simbad SDSS |  |
LC Plot |
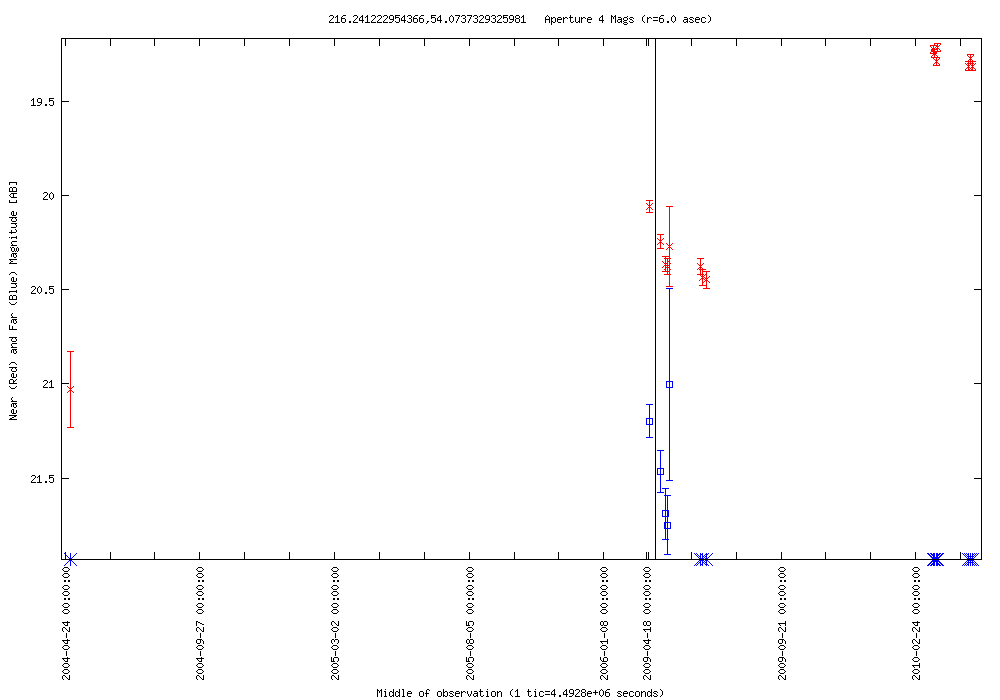
| 2010-04-30 16:28:48-07 | 216.24122 +54.07373 | 1.236 | 19.211 | 15 | 0.749 | 21.001 | 5 | QSO | SDSS J142457.86+540425.2 | z=0.67 | NED Simbad SDSS |  |
LC Plot |
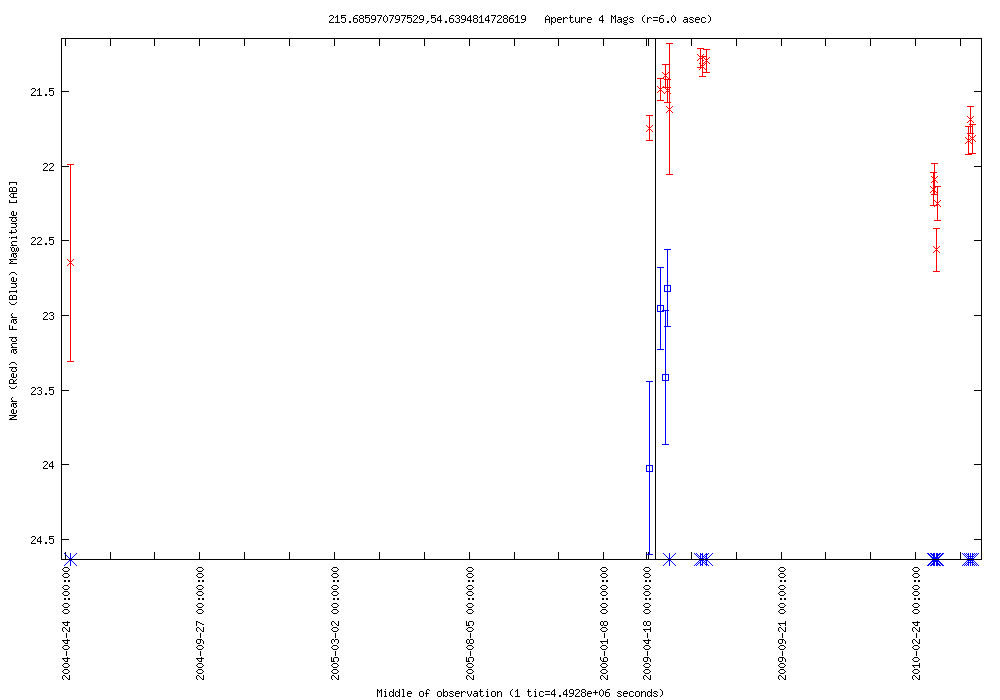
| 2010-04-30 16:28:48-07 | 215.68597 +54.63948 | 1.288 | 21.271 | 15 | 1.206 | 22.817 | 4 | AGN? | SDSS J142244.66+543822.7 | blue, stellar | NED Simbad SDSS |  |
LC Plot |
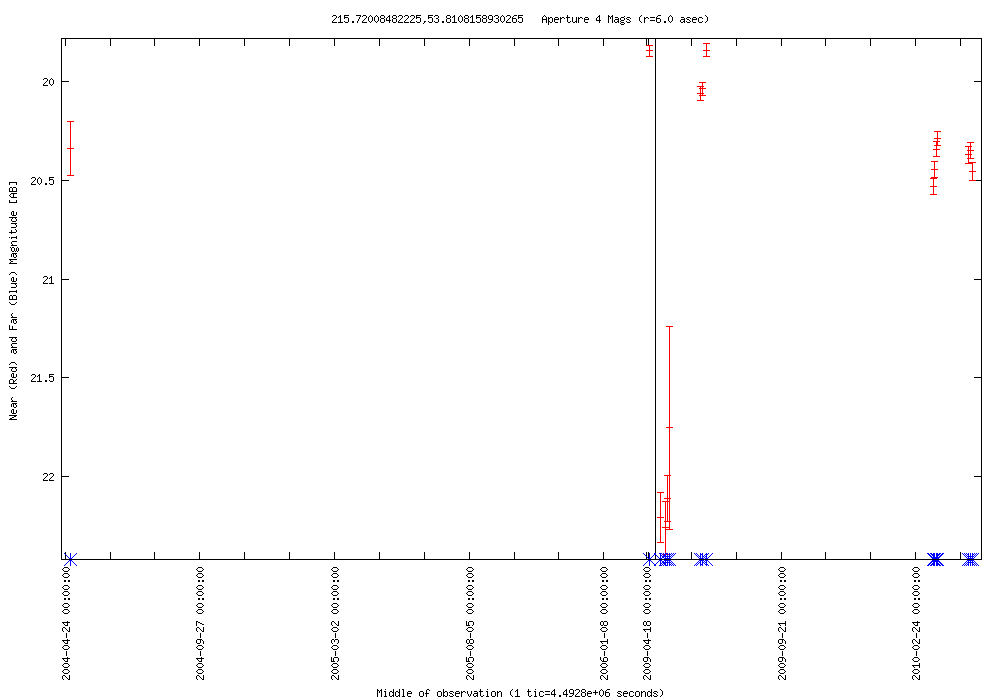
| 2010-04-30 16:28:48-07 | 215.72008 +53.81082 | 2.421 | 19.840 | 15 | 0.000 | 0.000 | 0 | Mira | S Boo | SDSS shows bright, red star | NED Simbad SDSS |  |
LC Plot |
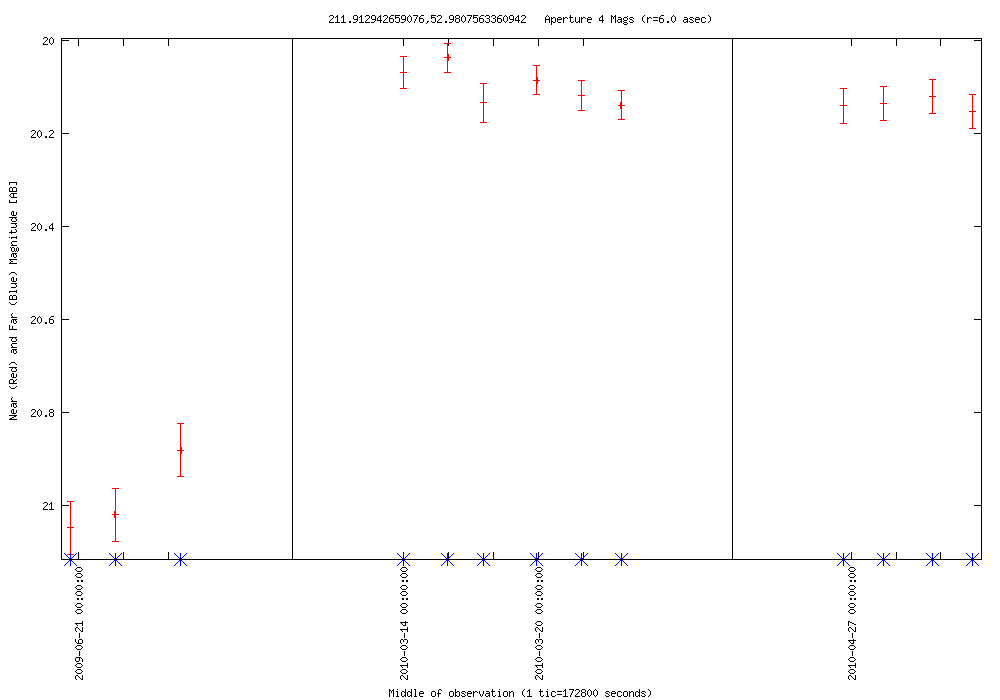
| 2010-04-30 14:50:09-07 | 211.91294 +52.98076 | 1.011 | 20.038 | 12 | 0.000 | 0.000 | 0 | AGN? | SDSS J140739.17+525850.7 | blue, stellar | NED Simbad SDSS |  |
LC Plot |
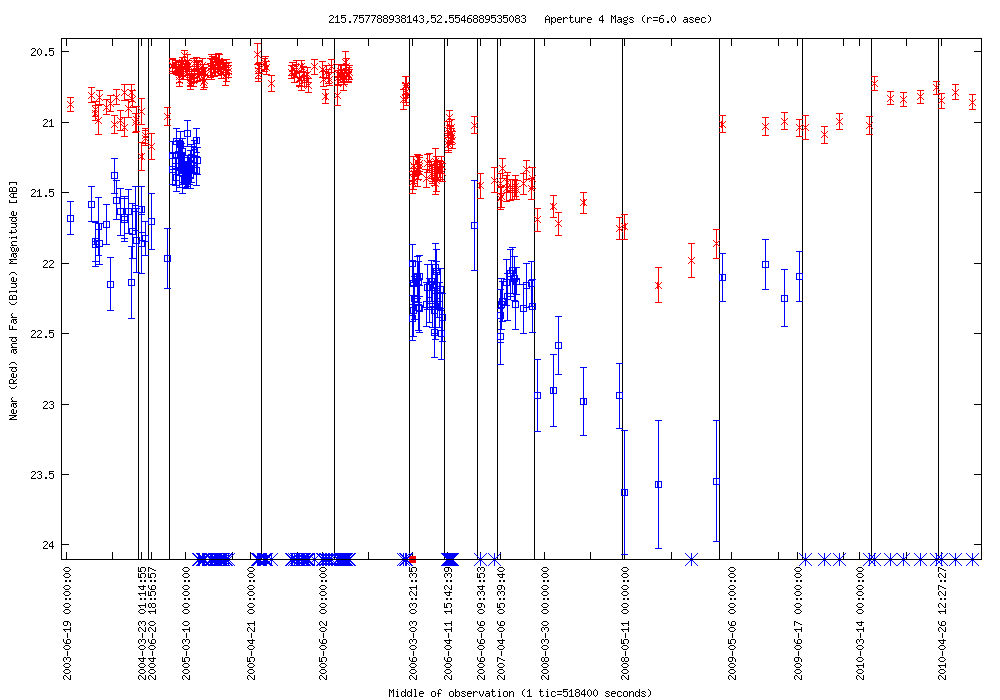
| 2010-04-30 11:32:53-07 | 215.75779 +52.55469 | 1.637 | 20.518 | 212 | 2.546 | 21.081 | 111 | AGN? | SDSS J142301.87+523316.5 | SDSS classified as a star | NED Simbad SDSS |  |
LC Plot |
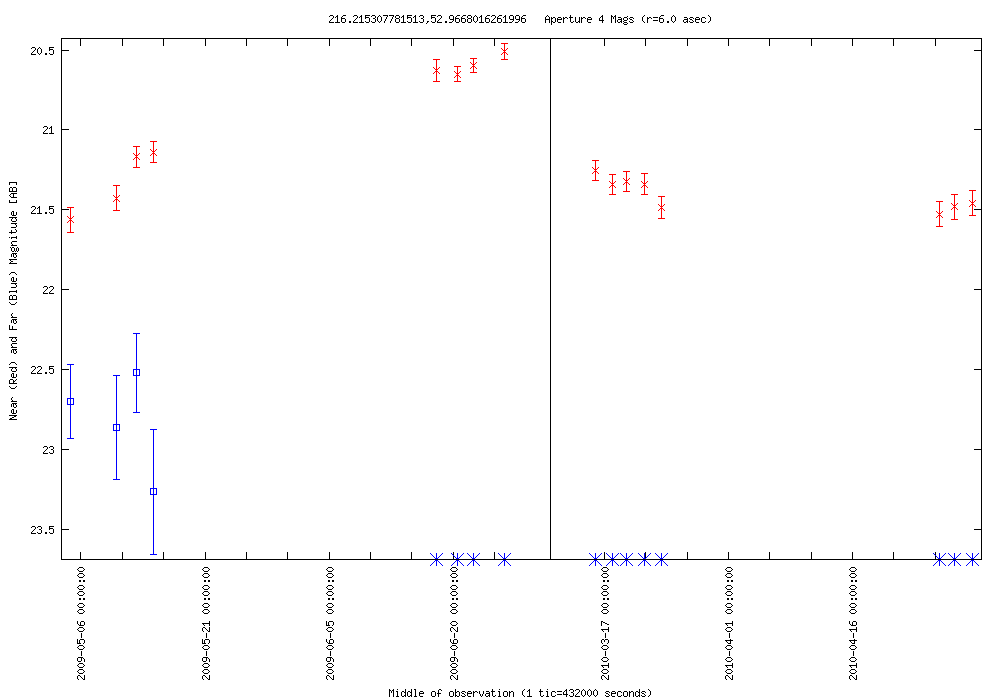
| 2010-04-30 11:32:53-07 | 216.21531 +52.96680 | 1.054 | 20.509 | 16 | 0.745 | 22.518 | 4 | AGN? | - | faint galaxy | NED Simbad SDSS |  |
LC Plot |
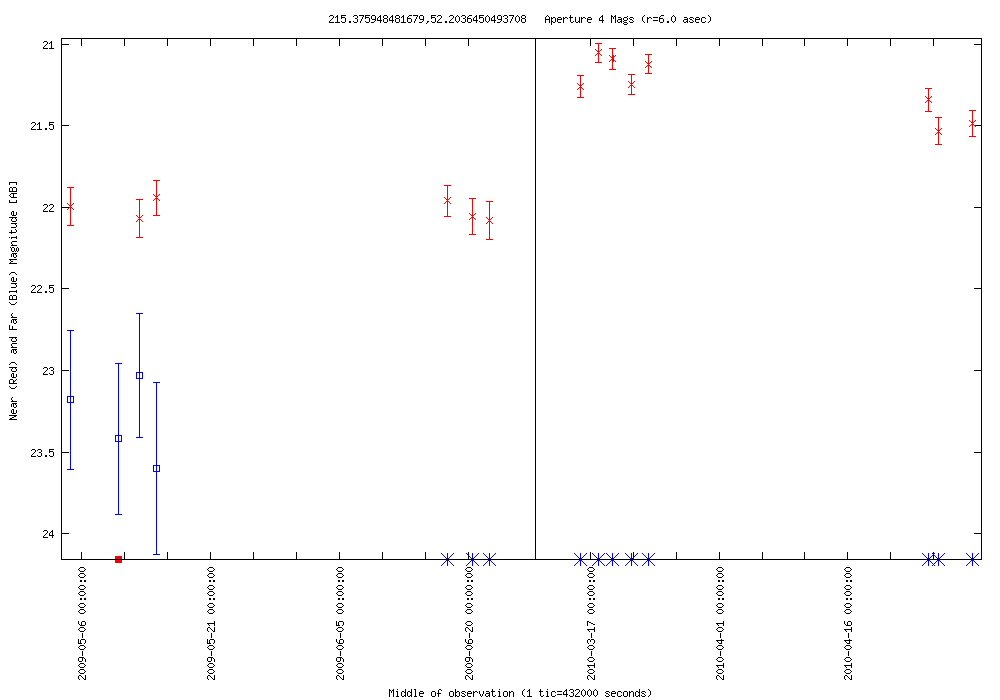
| 2010-04-30 11:32:53-07 | 215.37595 +52.20365 | 1.026 | 21.055 | 14 | 0.569 | 23.030 | 4 | AGN? | SDSS J142130.28+521212.4 | SDSS classified as a star | NED Simbad SDSS |  |
LC Plot |
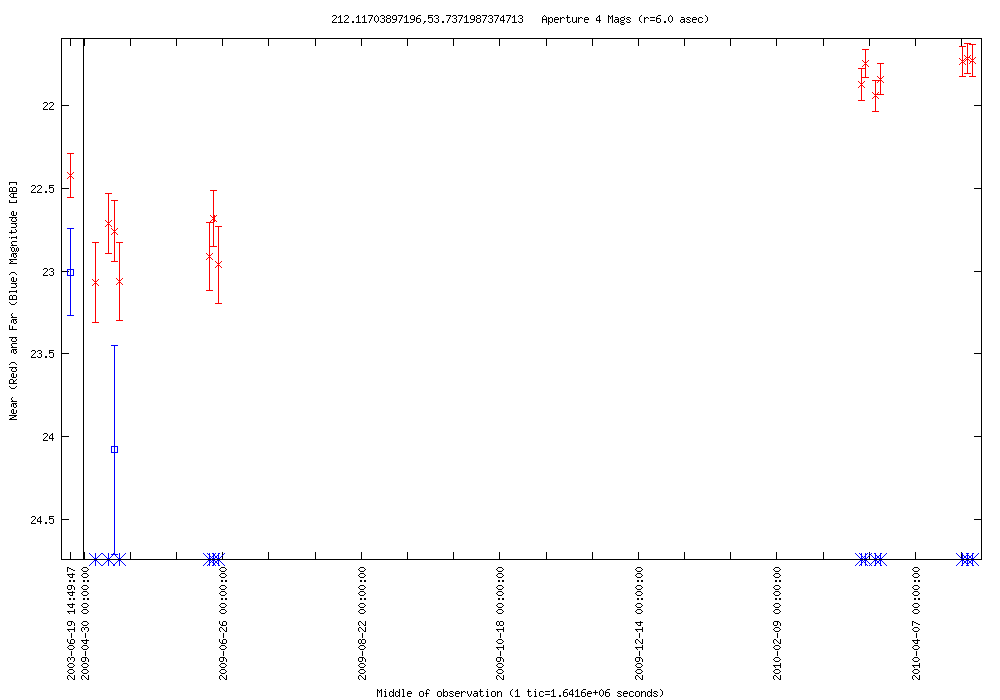
| 2010-04-30 09:54:14-07 | 212.11704 +53.73720 | 1.354 | 21.715 | 15 | 1.073 | 23.006 | 2 | Radio source | SDSS J140828.09+534413.8 | SDSS classified as a star | NED Simbad SDSS |  |
LC Plot |
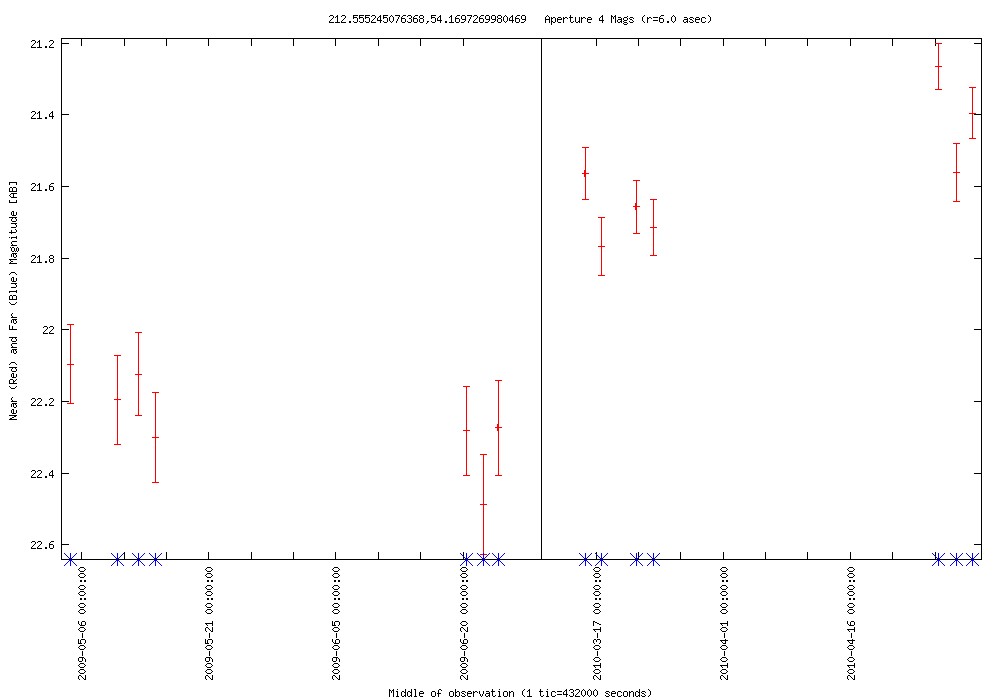
| 2010-04-30 09:54:14-07 | 212.55525 +54.16973 | 1.221 | 21.266 | 14 | 0.000 | 0.000 | 0 | AGN? | SDSS J141013.32+541012.9 | SDSS classified as a star | NED Simbad SDSS |  |
LC Plot |
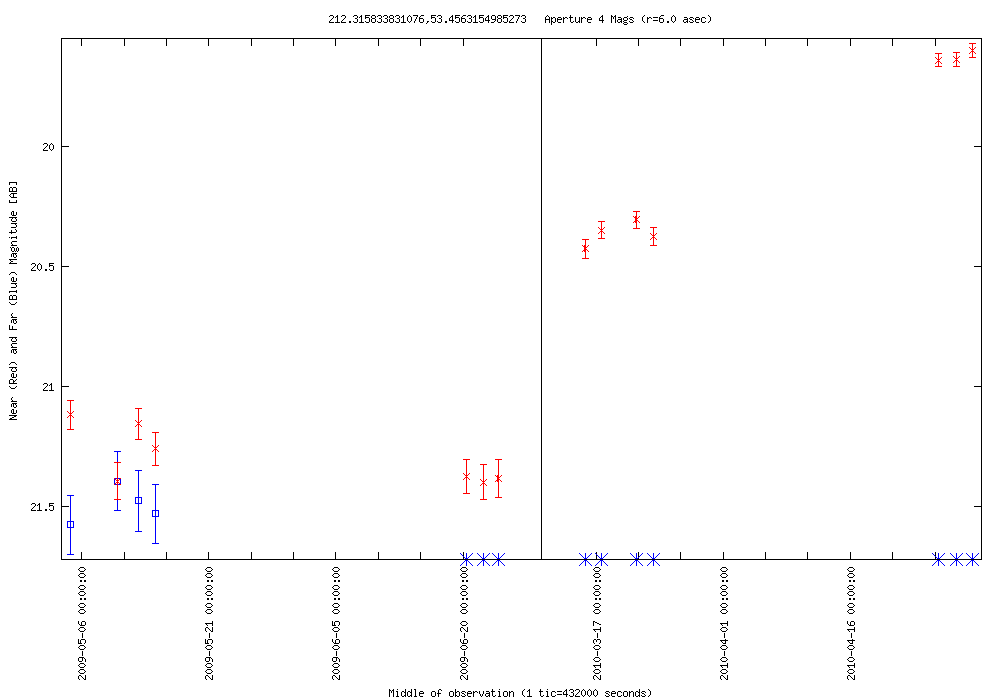
| 2010-04-30 09:54:14-07 | 212.31583 +53.45632 | 1.803 | 19.598 | 14 | 0.182 | 21.396 | 4 | QSO | SDSS J140915.69+532721.8 | z=0.26 | NED Simbad SDSS |  |
LC Plot |
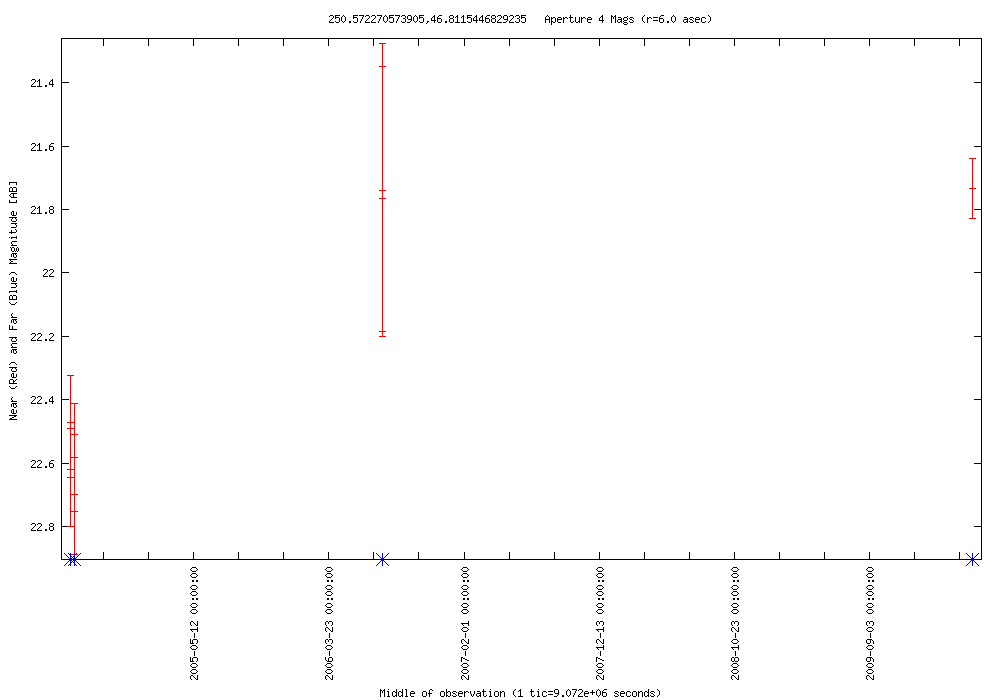
| 2010-04-30 01:41:02-07 | 250.57227 +46.81154 | 0.965 | 21.732 | 5 | 0.000 | 0.000 | 0 | AGN? | SDSS J164217.37+464842.6 | SDSS classified as a star | NED Simbad SDSS |  |
LC Plot |
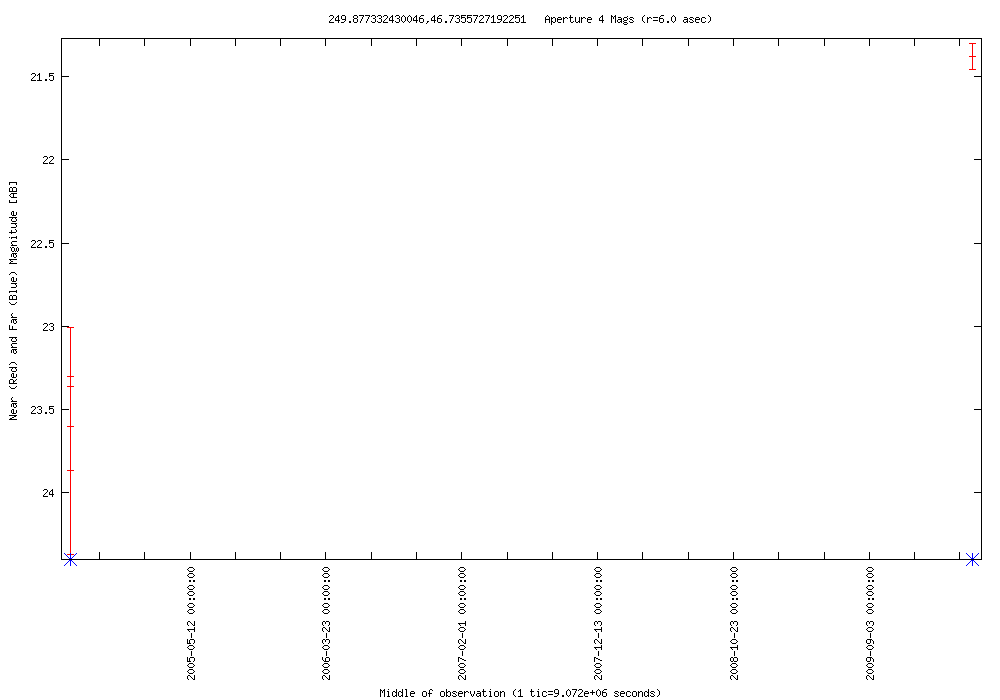
| 2010-04-30 01:41:02-07 | 249.87733 +46.73557 | 2.486 | 21.381 | 3 | 0.000 | 0.000 | 0 | AGN? | SDSS J163930.56+464407.8 | SDSS classified as a galaxy | NED Simbad SDSS |  |
LC Plot |
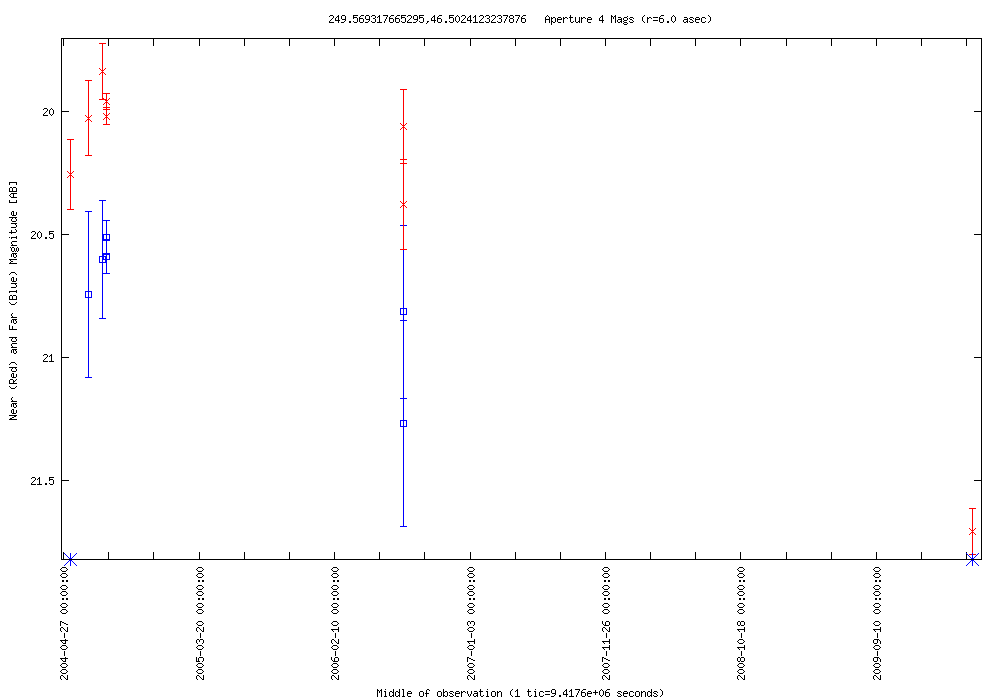
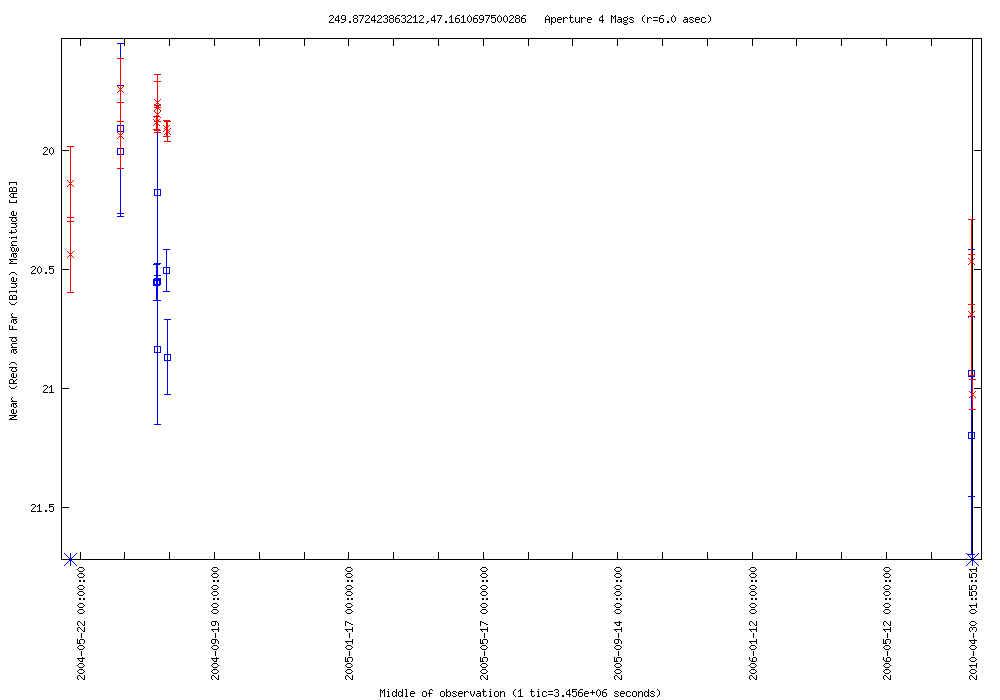
| 2010-04-30 01:41:02-07 | 249.56932 +46.50241 | 1.748 | 19.959 | 3 | 0.079 | 20.512 | 2 | AGN? | SDSS J163816.59+463007.5 | SDSS classified as a galaxy | NED Simbad SDSS |  |
LC Plot |
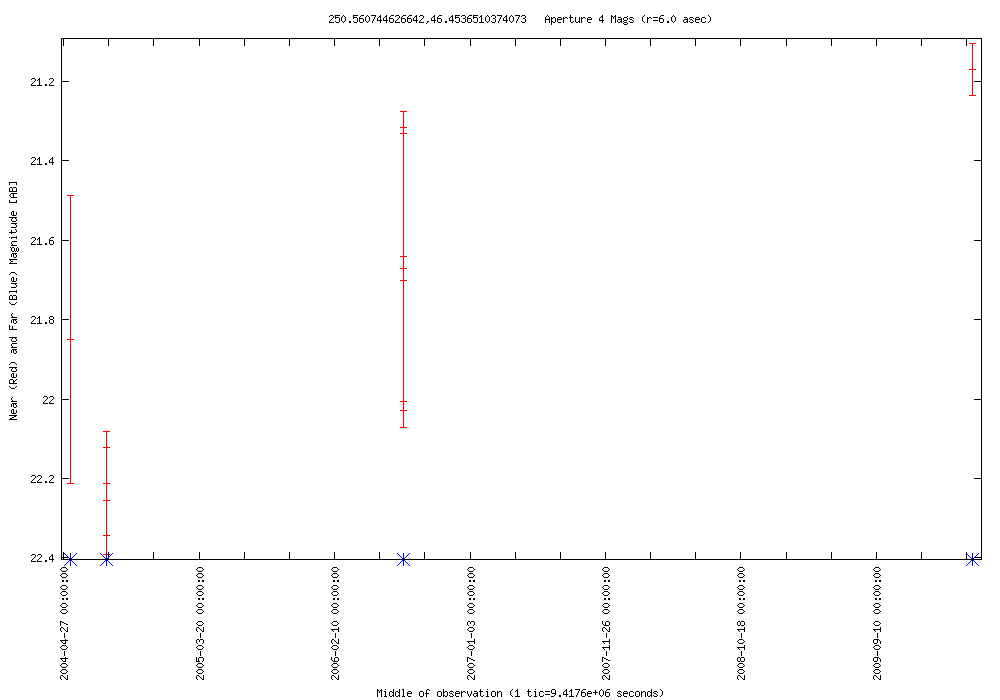
| 2010-04-30 01:41:02-07 | 250.56074 +46.45365 | 1.086 | 21.170 | 3 | 0.000 | 0.000 | 0 | AGN? | SDSS J164214.62+462713.3 | SDSS classified as a star | NED Simbad SDSS |  |
LC Plot |
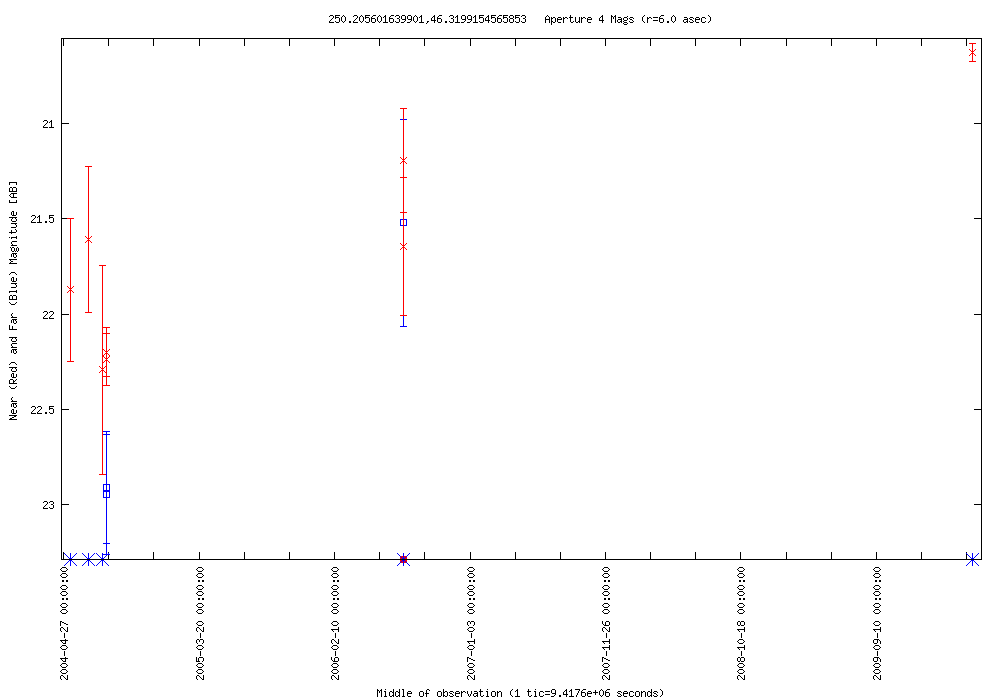
| 2010-04-30 01:41:02-07 | 250.20560 +46.31992 | 1.610 | 20.628 | 3 | 0.037 | 22.912 | 2 | UvES | SDSS J164049.36+461910.8 | SDSS classified as a star | NED Simbad SDSS |  |
LC Plot |
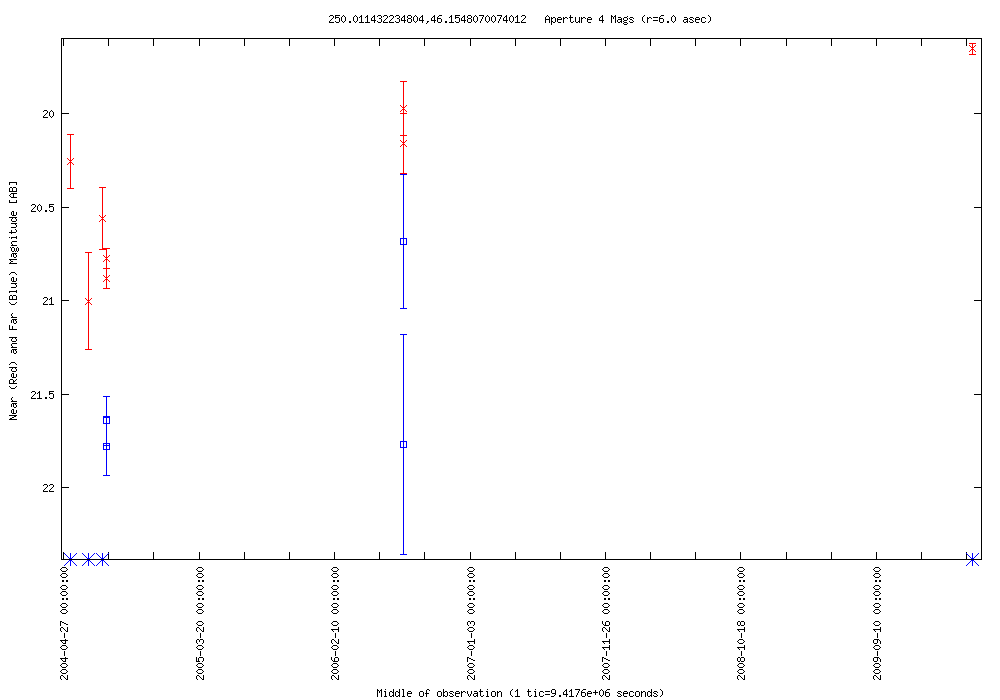
| 2010-04-30 01:41:02-07 | 250.01143 +46.15481 | 1.230 | 19.652 | 3 | 0.135 | 21.642 | 2 | AGN? | SDSS J164002.63+460916.2 | blue, stellar | NED Simbad SDSS |  |
LC Plot |
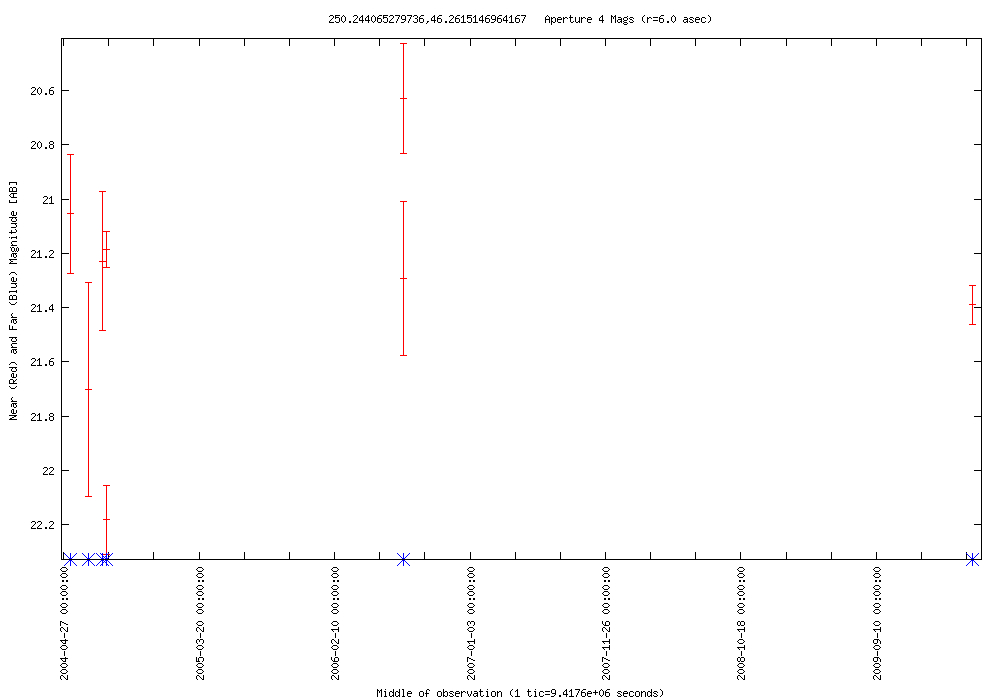
| 2010-04-30 01:41:02-07 | 250.24407 +46.26151 | 0.997 | 21.186 | 3 | 0.000 | 0.000 | 0 | AGN? | SDSS J164058.57+461540.6 | SDSS classified as a star | NED Simbad SDSS |  |
LC Plot |
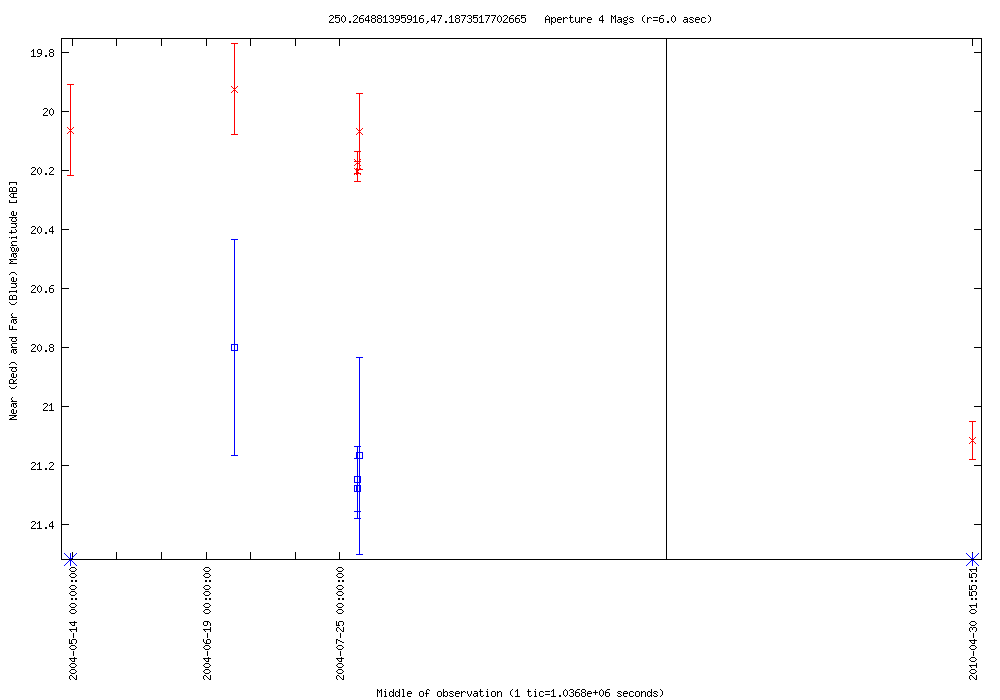
| 2010-04-30 01:41:02-07 | 250.26488 +47.18735 | 0.942 | 20.173 | 3 | 0.032 | 21.245 | 2 | AGN? | SDSS J164103.59+471114.9 | SDSS classified as a galaxy | NED Simbad SDSS |  |
LC Plot |
| 2010-04-30 01:41:02-07 | 249.87242 +47.16107 | 1.176 | 19.850 | 3 | 0.003 | 20.553 | 2 | VisS | SDSS J163929.39+470939.9 | QSO candidate | NED Simbad SDSS |  |
LC Plot |
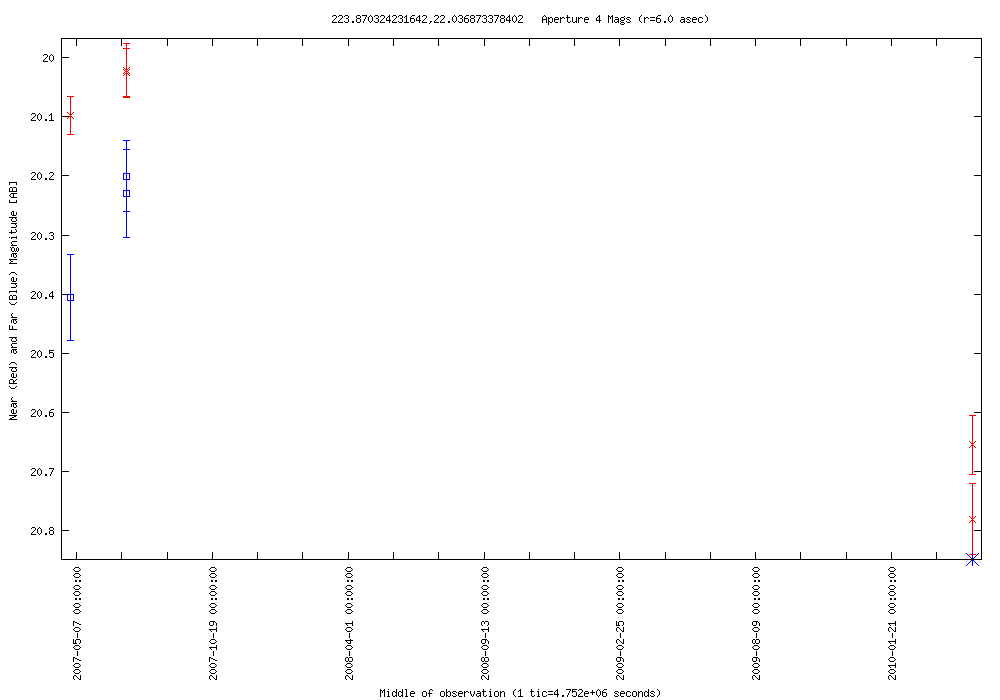
| 2010-04-29 09:14:37-07 | 223.87032 +22.03687 | 0.759 | 20.022 | 5 | 0.206 | 20.200 | 3 | AGN? | SDSS J145528.71+220212.3 | SDSS classified as a galaxy | NED Simbad SDSS |  |
LC Plot |
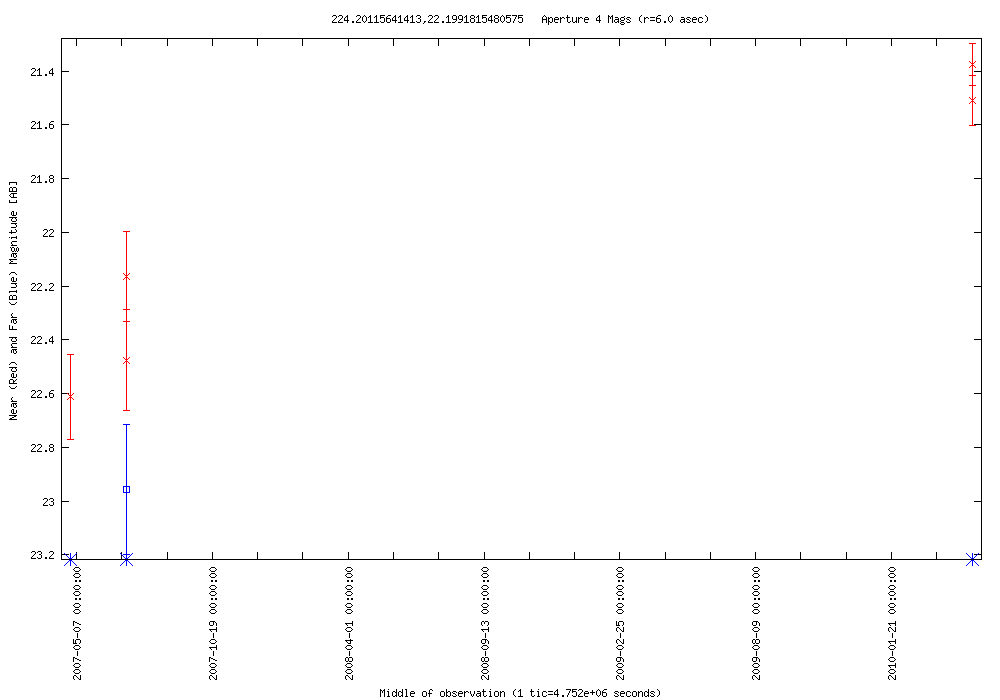
| 2010-04-29 09:14:37-07 | 224.20116 +22.19918 | 1.237 | 21.375 | 5 | 0.000 | 22.956 | 1 | AGN? | SDSS J145648.25+221156.4 | SDSS classified as a star | NED Simbad SDSS |  |
LC Plot |
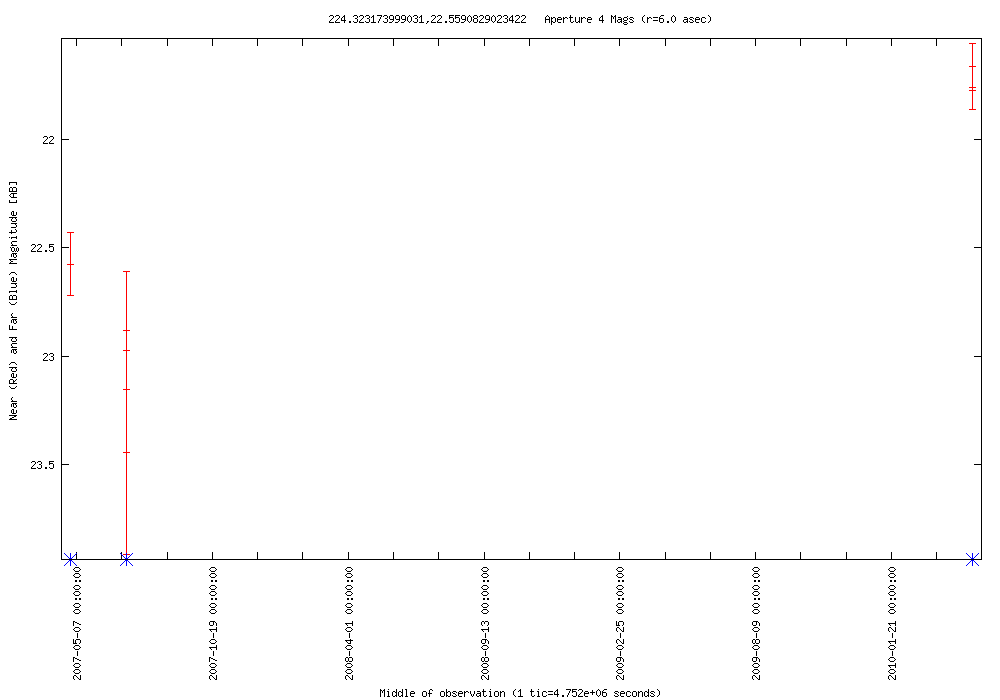
| 2010-04-29 09:14:37-07 | 224.32317 +22.55908 | 1.782 | 21.664 | 5 | 0.000 | 0.000 | 0 | AGN? | SDSS J145717.55+223332.0 | faint galaxy | NED Simbad SDSS |  |
LC Plot |
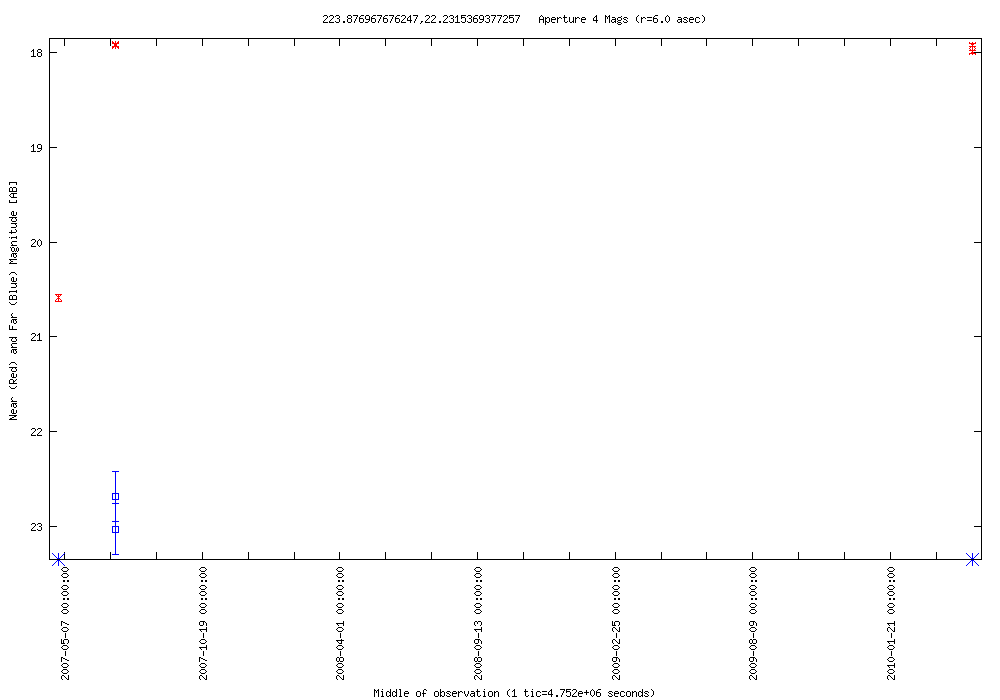
| 2010-04-29 09:14:37-07 | 223.87697 +22.23154 | 2.672 | 17.918 | 5 | 0.343 | 22.689 | 2 | RR Lyrae? | SDSS J145530.42+221353.2 | SDSS classified as a star | NED Simbad SDSS |  |
LC Plot |
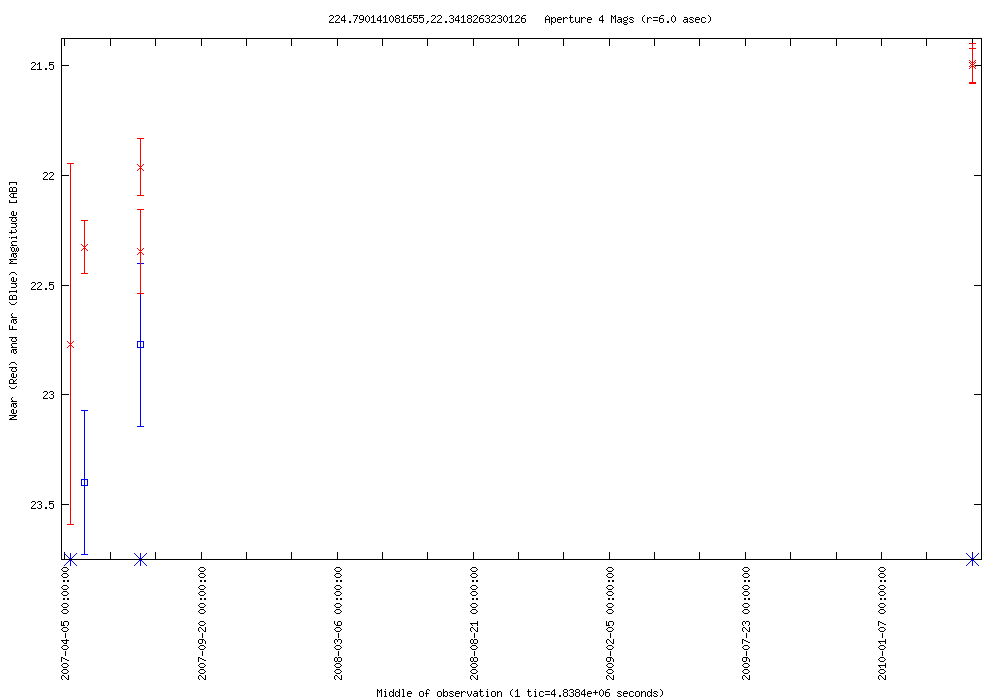
| 2010-04-29 09:14:37-07 | 224.79014 +22.34183 | 0.858 | 21.487 | 5 | 0.628 | 22.772 | 2 | AGN? | SDSS J145909.66+222029.0 | neighbors nearby | NED Simbad SDSS |  |
LC Plot |
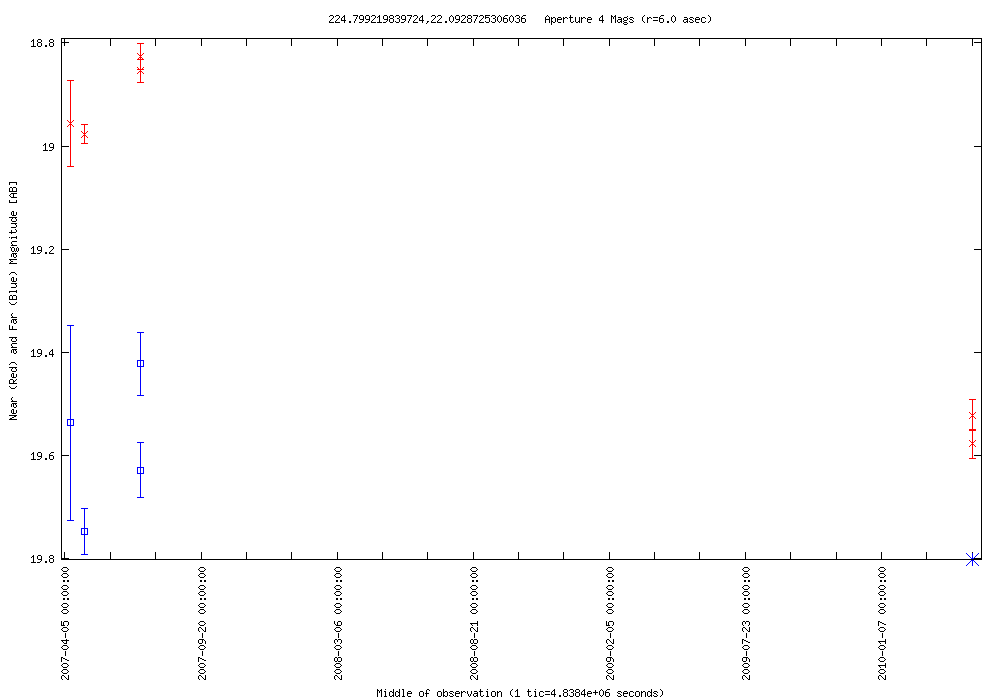
| 2010-04-29 09:14:37-07 | 224.79922 +22.09287 | 0.750 | 18.826 | 5 | 0.325 | 19.422 | 3 | AGN? | SDSS J145911.75+220533.9 | blue, stellar | NED Simbad SDSS |  |
LC Plot |
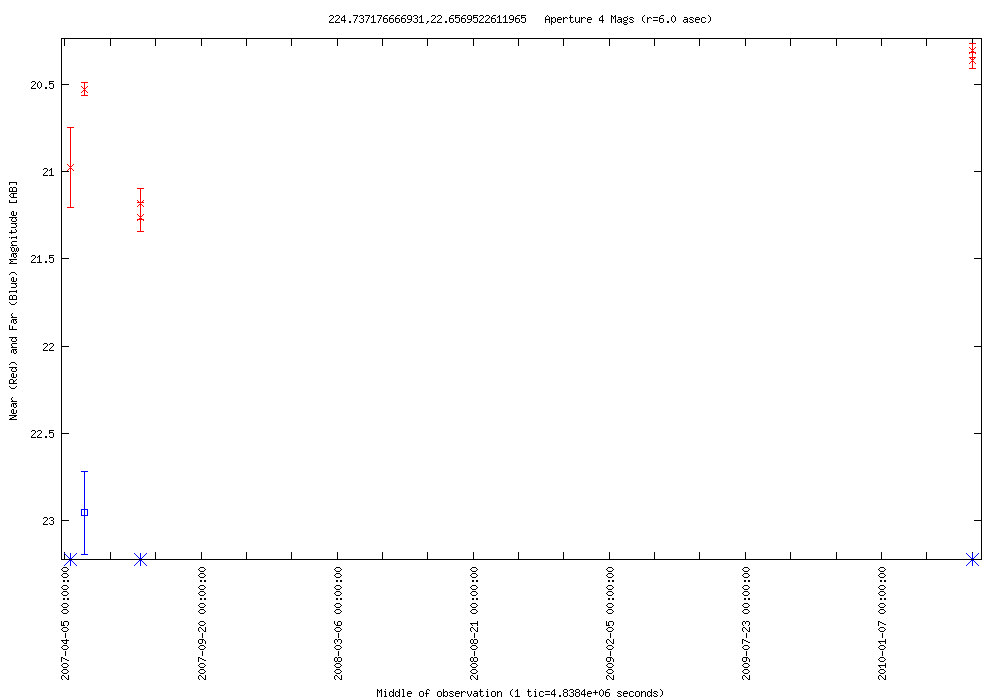
| 2010-04-29 09:14:37-07 | 224.73718 +22.65695 | 0.955 | 20.305 | 5 | 0.000 | 22.955 | 1 | RR Lyrae? | SDSS J145856.91+223924.6 | blue star, SDSS spectrum | NED Simbad SDSS |  |
LC Plot |
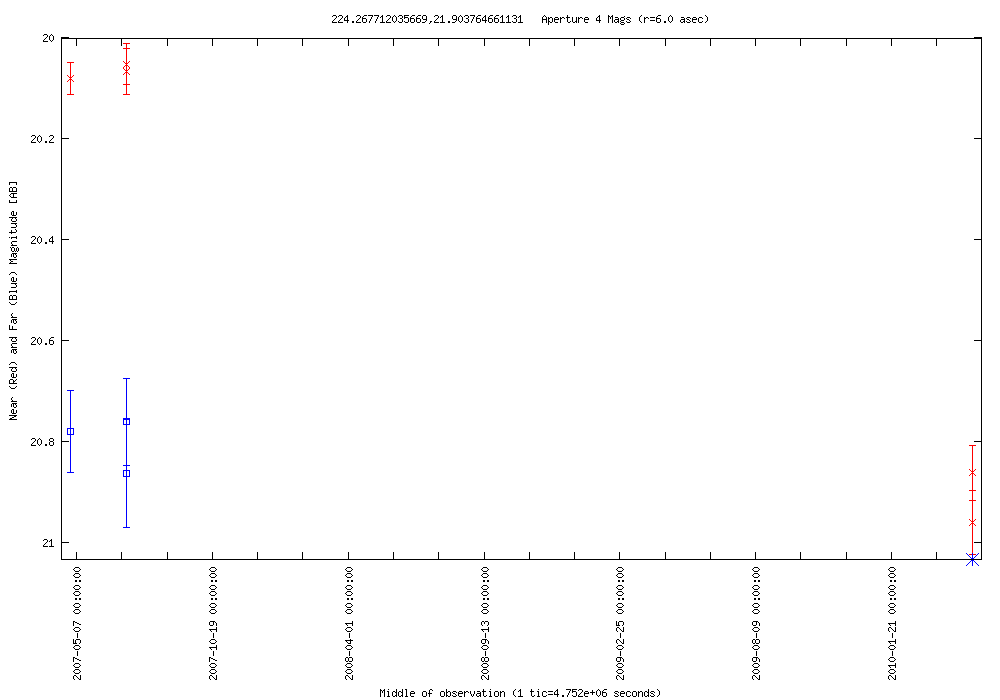
| 2010-04-29 09:14:37-07 | 224.26771 +21.90376 | 0.909 | 20.052 | 5 | 0.102 | 20.761 | 3 | QSO | SDSS J145704.22+215413.1 | z=1.40 | NED Simbad SDSS |  |
LC Plot |
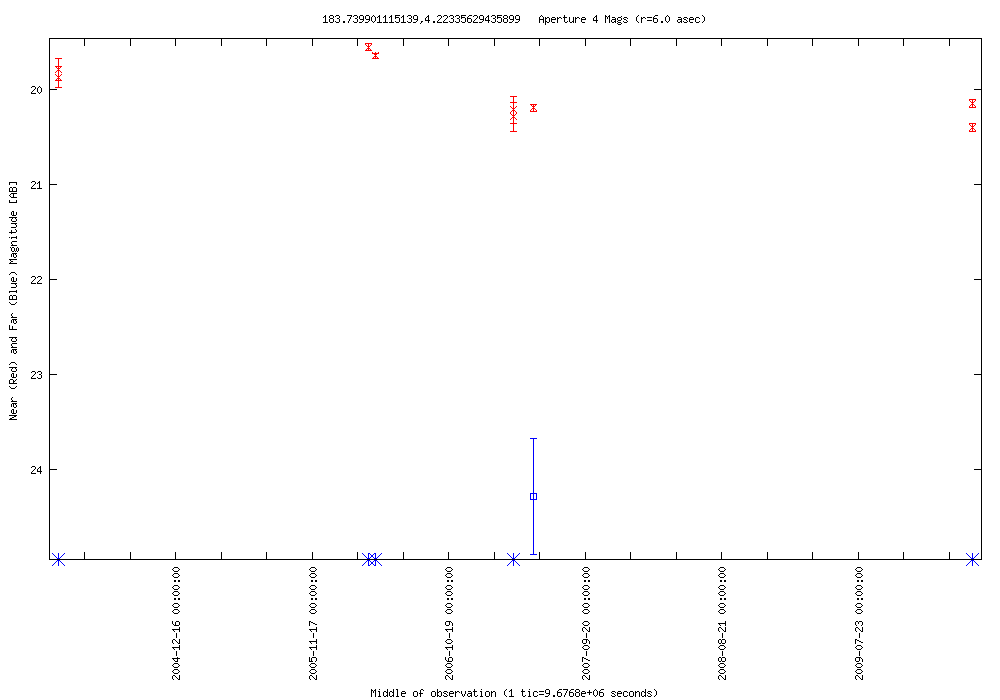
| 2010-04-29 02:40:03-07 | 183.73990 +04.22336 | 0.847 | 19.556 | 5 | 0.000 | 24.289 | 1 | RR Lyrae? | SDSS J121457.54+041323.6 | blue star | NED Simbad SDSS |  |
LC Plot |
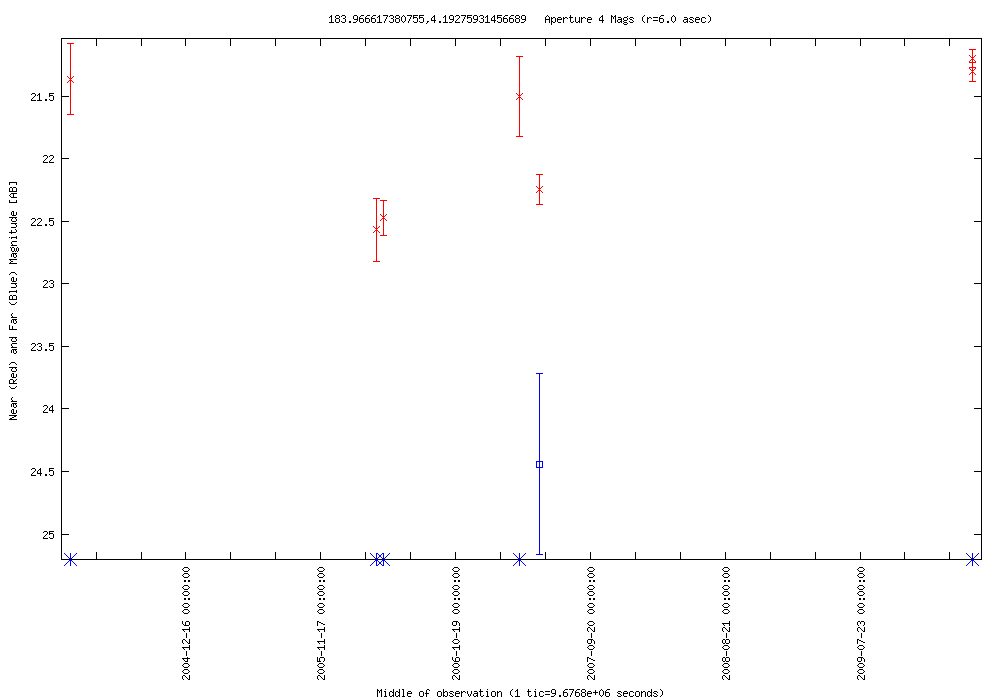
| 2010-04-29 02:40:03-07 | 183.96662 +04.19276 | 1.372 | 21.196 | 5 | 0.000 | 24.440 | 1 | UvES | SDSS J121551.97+041133.0 | SDSS classified as a star | NED Simbad SDSS |  |
LC Plot |
| 2010-04-29 01:01:24-07 | 224.73718 +22.65695 | 0.895 | 20.364 | 4 | 0.000 | 22.955 | 1 | RR Lyrae? | SDSS J145856.91+223924.6 | blue star, SDSS spectrum | NED Simbad SDSS | |
LC Plot |
| 2010-04-29 01:01:24-07 | 224.20116 +22.19918 | 1.103 | 21.509 | 4 | 0.000 | 22.956 | 1 | AGN? | SDSS J145648.25+221156.4 | SDSS classified as a star | NED Simbad SDSS | |
LC Plot |
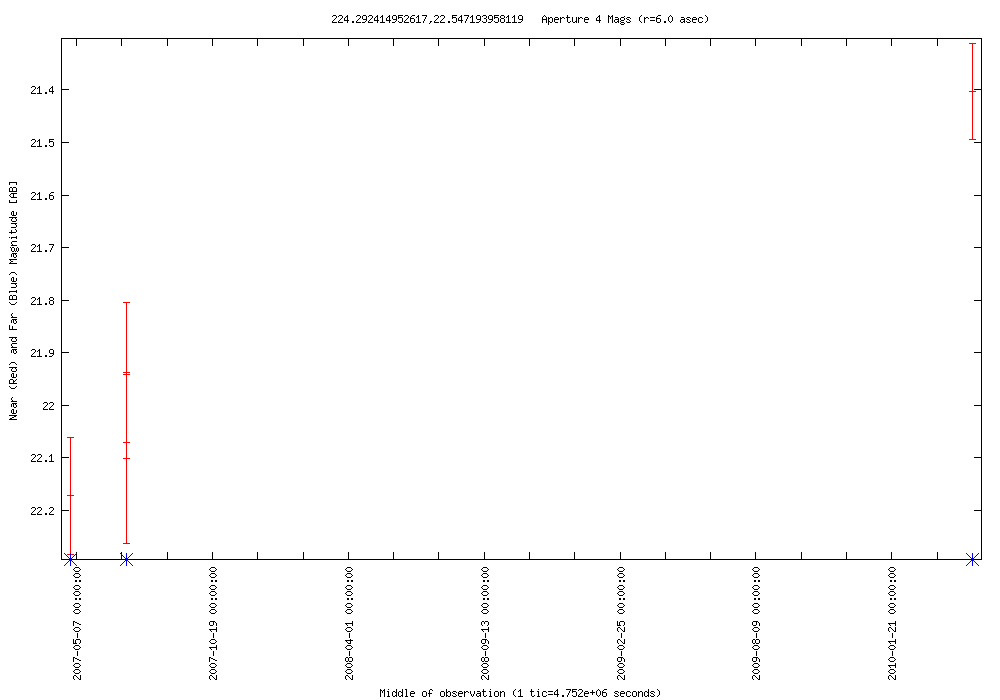
| 2010-04-29 01:01:24-07 | 224.29241 +22.54719 | 0.769 | 21.403 | 4 | 0.000 | 0.000 | 0 | AGN? | SDSS J145710.21+223248.5 | blue, stellar | NED Simbad SDSS |  |
LC Plot |
| 2010-04-29 01:01:24-07 | 224.26771 +21.90376 | 0.909 | 20.052 | 4 | 0.102 | 20.761 | 3 | QSO | SDSS J145704.22+215413.1 | z=1.40 | NED Simbad SDSS | |
LC Plot |
| 2010-04-29 01:01:24-07 | 223.87697 +22.23154 | 2.672 | 17.918 | 4 | 0.343 | 22.689 | 2 | RR Lyrae? | SDSS J145530.42+221353.2 | SDSS classified as a star | NED Simbad SDSS | |
LC Plot |
| 2010-04-29 01:01:24-07 | 224.32317 +22.55908 | 1.782 | 21.664 | 4 | 0.000 | 0.000 | 0 | AGN? | SDSS J145717.55+223332.0 | faint galaxy | NED Simbad SDSS | |
LC Plot |
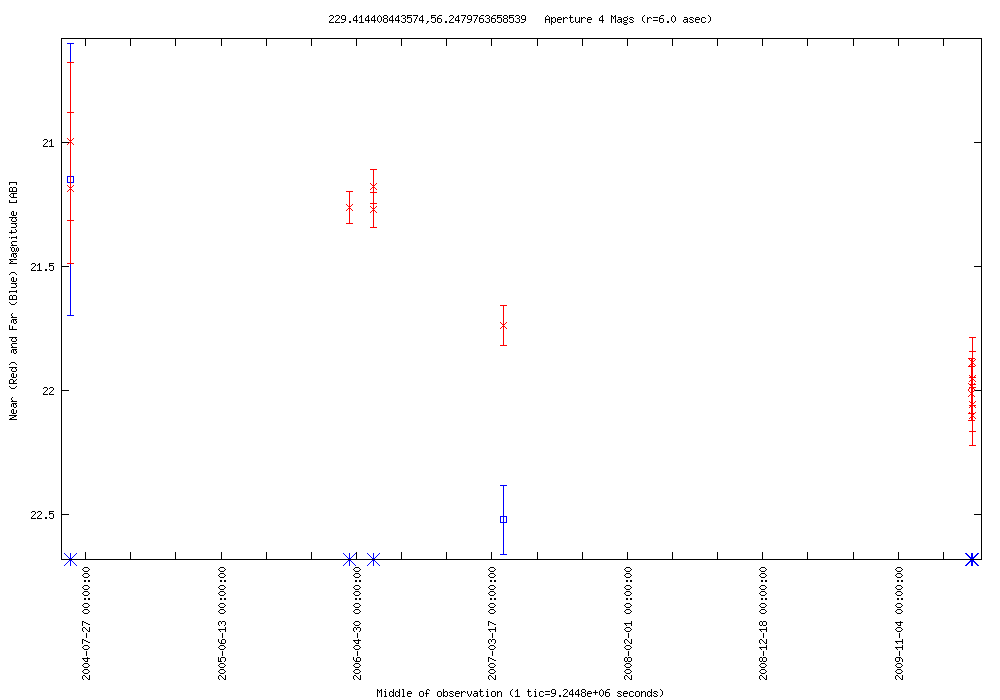
| 2010-04-28 20:05:28-07 | 229.41441 +56.24798 | 0.924 | 21.176 | 10 | 0.000 | 22.521 | 1 | QSO | SDSS J151739.48+561452.3 | z=2.22 | NED Simbad SDSS |  |
LC Plot |
| 2010-04-28 15:09:32-07 | 215.68597 +54.63948 | 1.288 | 21.271 | 14 | 1.206 | 22.817 | 4 | AGN? | SDSS J142244.66+543822.7 | blue, stellar | NED Simbad SDSS | |
LC Plot |
| 2010-04-28 15:09:32-07 | 216.24122 +54.07373 | 1.236 | 19.211 | 14 | 0.749 | 21.001 | 5 | QSO | SDSS J142457.86+540425.2 | z=0.67 | NED Simbad SDSS | |
LC Plot |
| 2010-04-28 15:09:32-07 | 215.72008 +53.81082 | 2.421 | 19.840 | 14 | 0.000 | 0.000 | 0 | Mira | S Boo | SDSS shows bright, red star | NED Simbad SDSS | |
LC Plot |
| 2010-04-28 15:09:32-07 | 214.94459 +54.38738 | 1.592 | 16.976 | 15 | 1.586 | 17.784 | 6 | QSO | [HB89] 1418+546 | z=0.15 | NED Simbad SDSS | |
LC Plot |
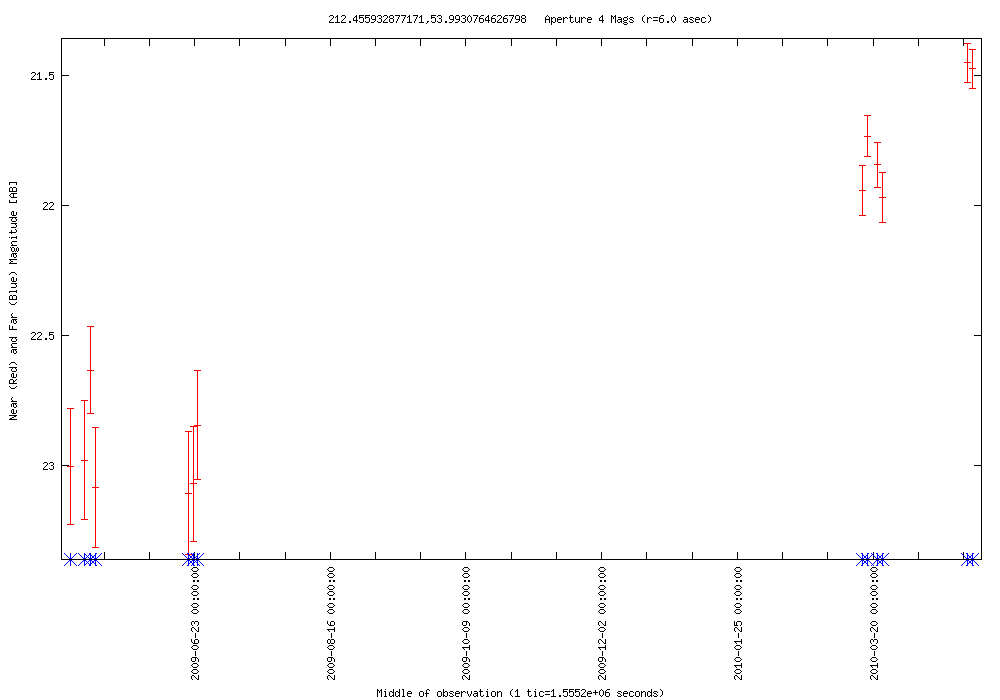
| 2010-04-28 11:52:15-07 | 212.45593 +53.99308 | 1.656 | 21.452 | 13 | 0.000 | 0.000 | 0 | AGN? | SDSS J140949.37+535935.6 | SDSS classified as a galaxy | NED Simbad SDSS |  |
LC Plot |
| 2010-04-28 11:52:15-07 | 212.11704 +53.73720 | 1.354 | 21.715 | 14 | 1.073 | 23.006 | 2 | Radio source | SDSS J140828.09+534413.8 | SDSS classified as a star | NED Simbad SDSS | |
LC Plot |
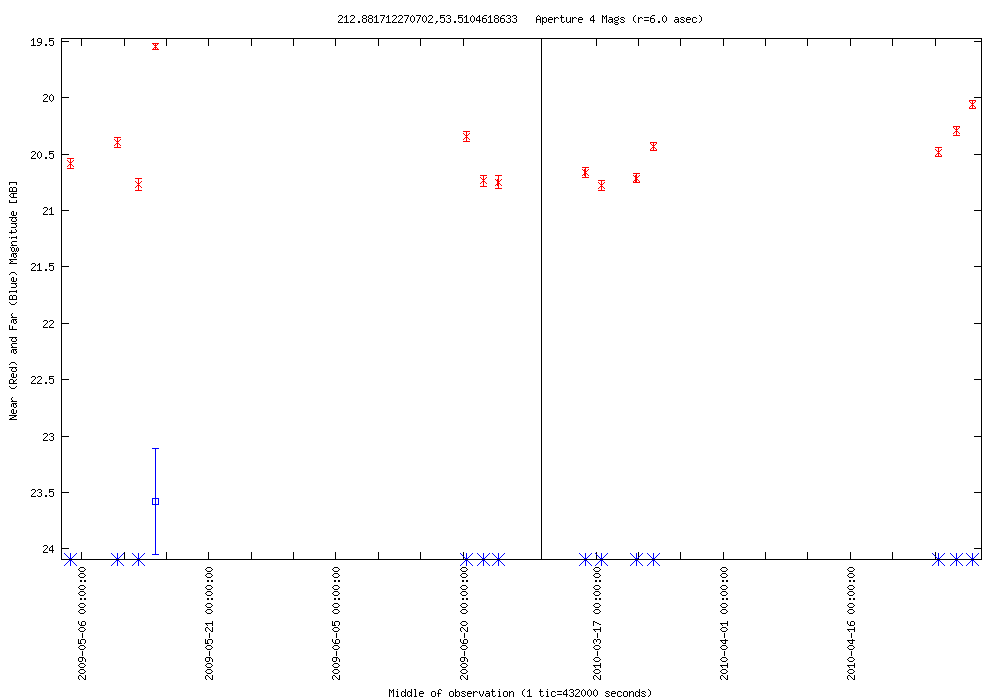
| 2010-04-28 11:52:15-07 | 212.88171 +53.51046 | 1.233 | 19.546 | 13 | 0.000 | 23.579 | 1 | RR Lyrae | CL Boo | [EHV2002] 2-6-0264 | NED Simbad SDSS |  |
LC Plot |
| 2010-04-28 11:52:15-07 | 212.31583 +53.45632 | 1.763 | 19.637 | 13 | 0.182 | 21.396 | 4 | QSO | SDSS J140915.69+532721.8 | z=0.26 | NED Simbad SDSS | |
LC Plot |
| 2010-04-28 10:13:37-07 | 211.91294 +52.98076 | 1.011 | 20.038 | 11 | 0.000 | 0.000 | 0 | AGN? | SDSS J140739.17+525850.7 | blue, stellar | NED Simbad SDSS | |
LC Plot |
| 2010-04-28 06:56:19-07 | 215.75779 +52.55469 | 1.637 | 20.518 | 211 | 2.546 | 21.081 | 111 | AGN? | SDSS J142301.87+523316.5 | SDSS classified as a star | NED Simbad SDSS | |
LC Plot |
| 2010-04-28 06:56:19-07 | 216.21531 +52.96680 | 1.054 | 20.509 | 15 | 0.745 | 22.518 | 4 | AGN? | - | faint galaxy | NED Simbad SDSS | |
LC Plot |
| 2010-04-28 06:56:19-07 | 214.77156 +52.42461 | 1.861 | 20.213 | 224 | 1.649 | 21.066 | 115 | QSO | SDSS J141905.17+522527.7 | z=1.60 | NED Simbad SDSS |  |
LC Plot |
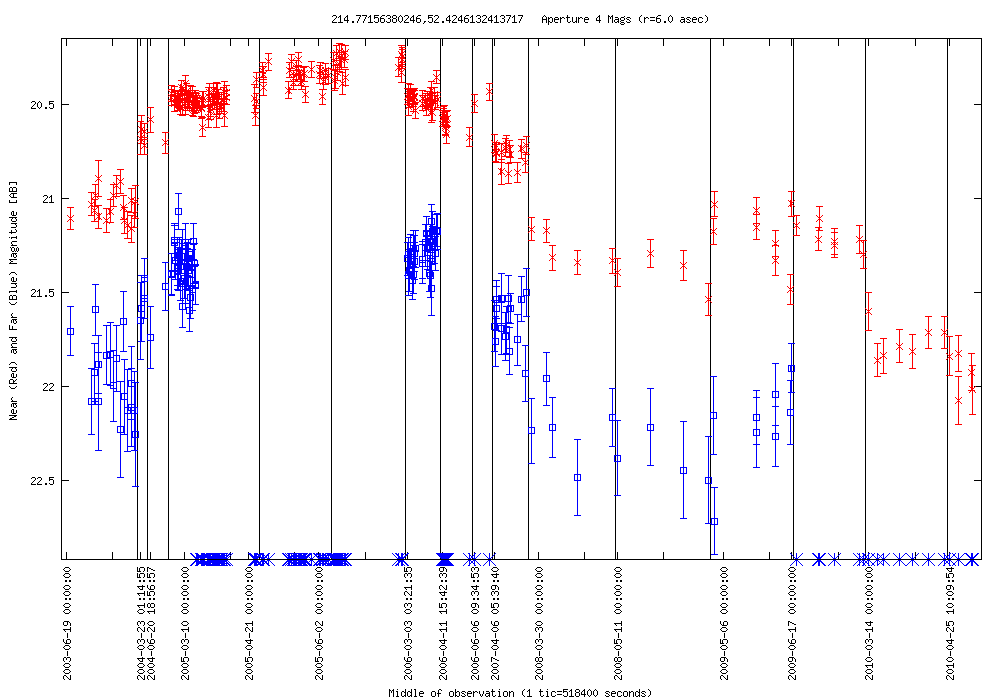
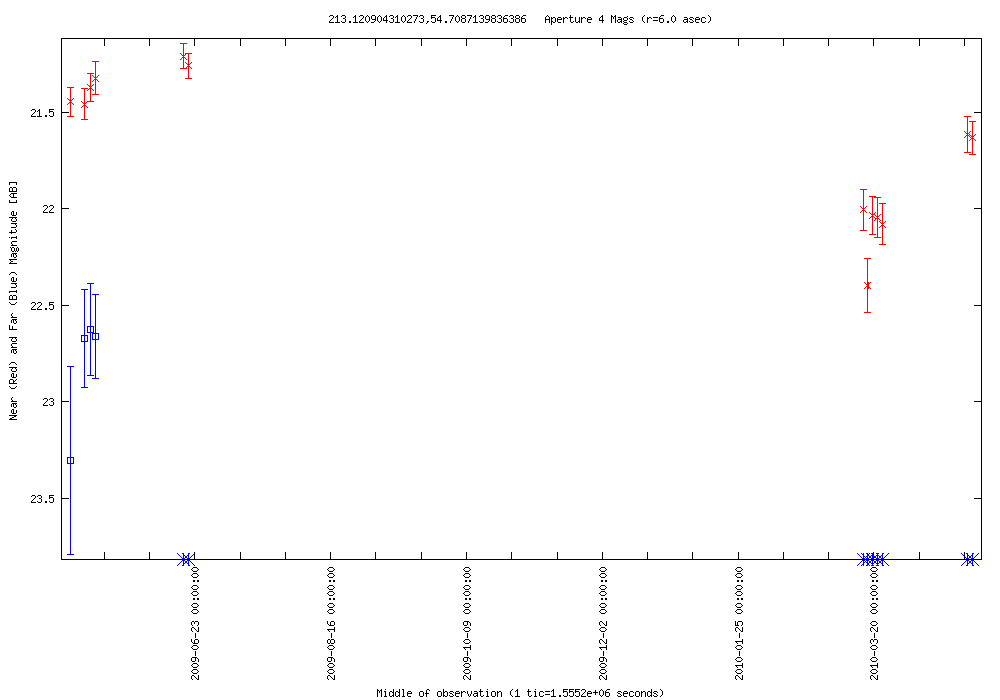
| 2010-04-28 05:17:41-07 | 213.12090 +54.70871 | 1.188 | 21.209 | 13 | 0.678 | 22.626 | 4 | AGN? | SDSS J141228.77+544230.5 | SDSS classified as a galaxy | NED Simbad SDSS |  |
LC Plot |
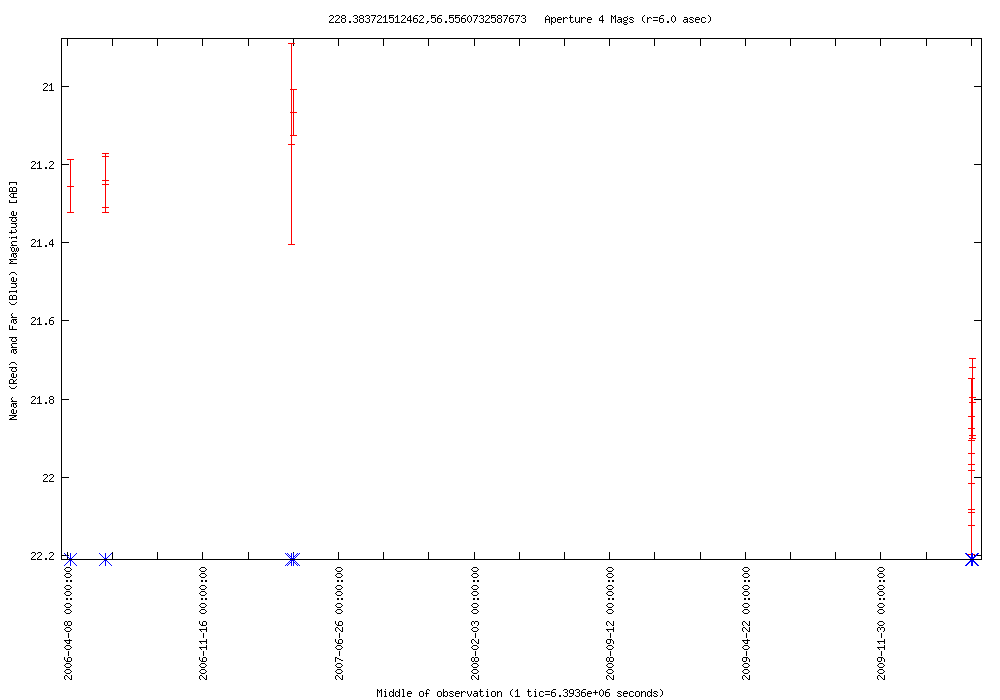
| 2010-04-27 16:08:38-07 | 228.38372 +56.55607 | 1.015 | 21.067 | 10 | 0.000 | 0.000 | 0 | QSO | SDSS J151332.08+563321.7 | z=1.85 | NED Simbad SDSS |  |
LC Plot |
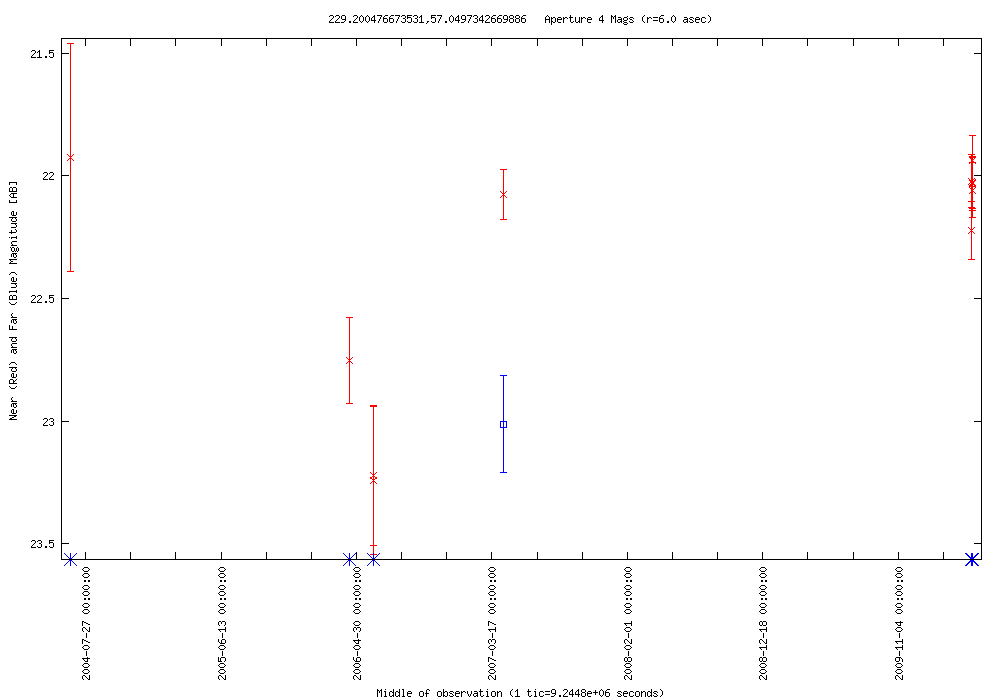
| 2010-04-27 16:08:38-07 | 229.20048 +57.04973 | 1.302 | 21.939 | 10 | 0.000 | 23.012 | 1 | UvES | SDSS J151648.19+570300.0 | SDSS classified as a star | NED Simbad SDSS |  |
LC Plot |
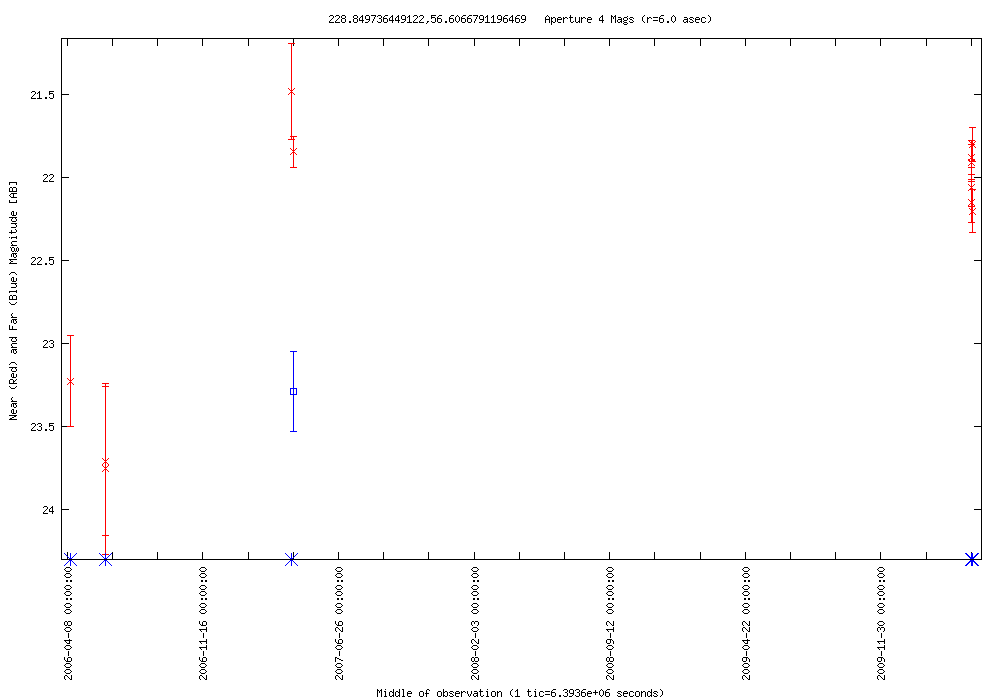
| 2010-04-27 16:08:38-07 | 228.84974 +56.60668 | 1.953 | 21.801 | 10 | 0.000 | 23.288 | 1 | AGN? | SDSS J151523.88+563623.7 | SDSS classified as a star | NED Simbad SDSS |  |
LC Plot |
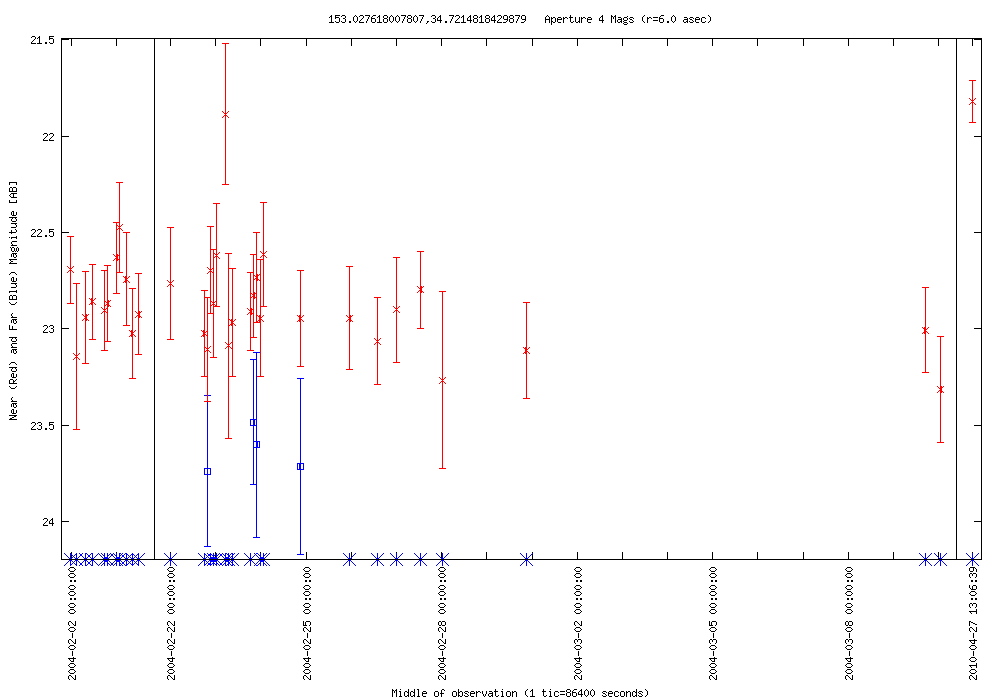
| 2010-04-27 12:51:21-07 | 153.02762 +34.72148 | 1.494 | 21.820 | 35 | 0.255 | 23.484 | 4 | AGN? | SDSS J101206.59+344316.1 | SDSS classified as a galaxy | NED Simbad SDSS |  |
LC Plot |
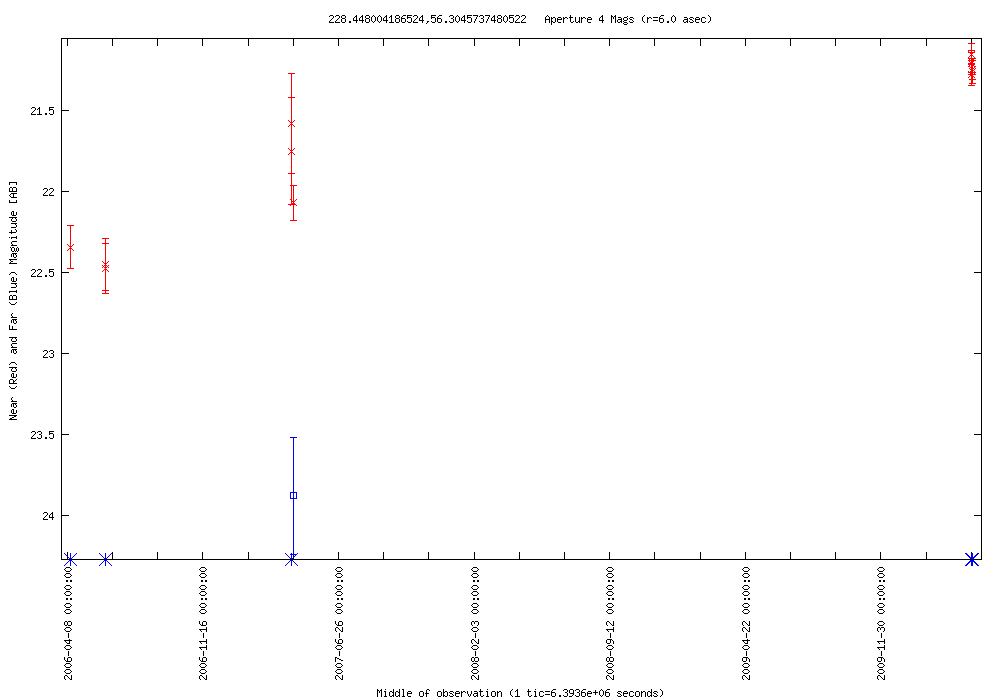
| 2010-04-27 11:12:42-07 | 228.44800 +56.30457 | 1.324 | 21.152 | 10 | 0.000 | 23.876 | 1 | X | RX J1513.8+5618 | SDSS classified as a star | NED Simbad SDSS |  |
LC Plot |
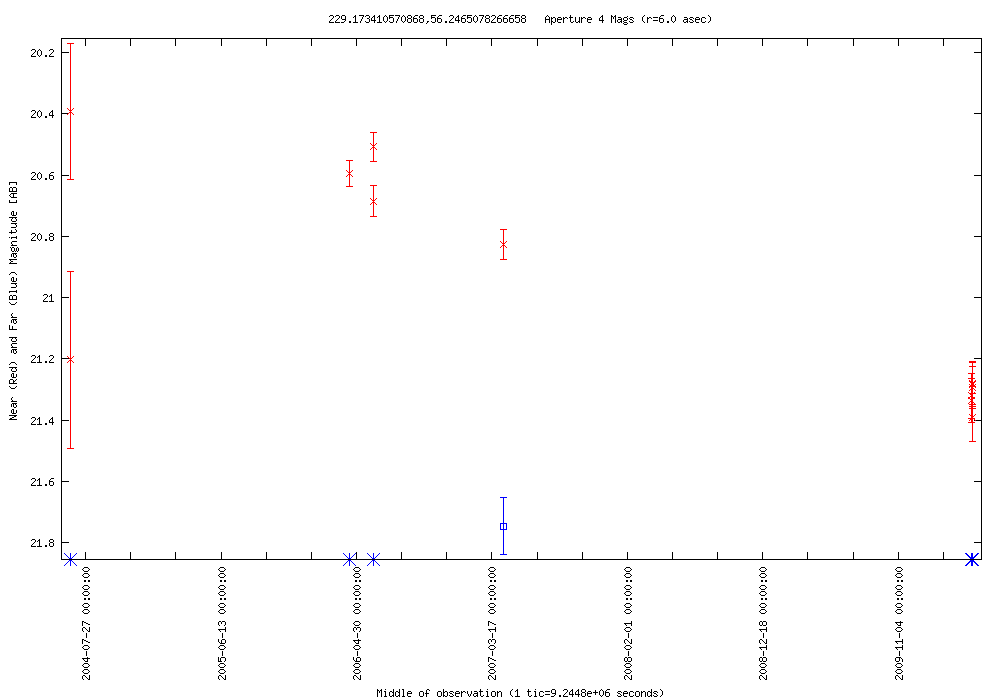
| 2010-04-27 11:12:42-07 | 229.17341 +56.24651 | 0.884 | 20.507 | 10 | 0.000 | 21.746 | 1 | QSO | SDSS J151641.59+561447.3 | z=1.48 | NED Simbad SDSS |  |
LC Plot |
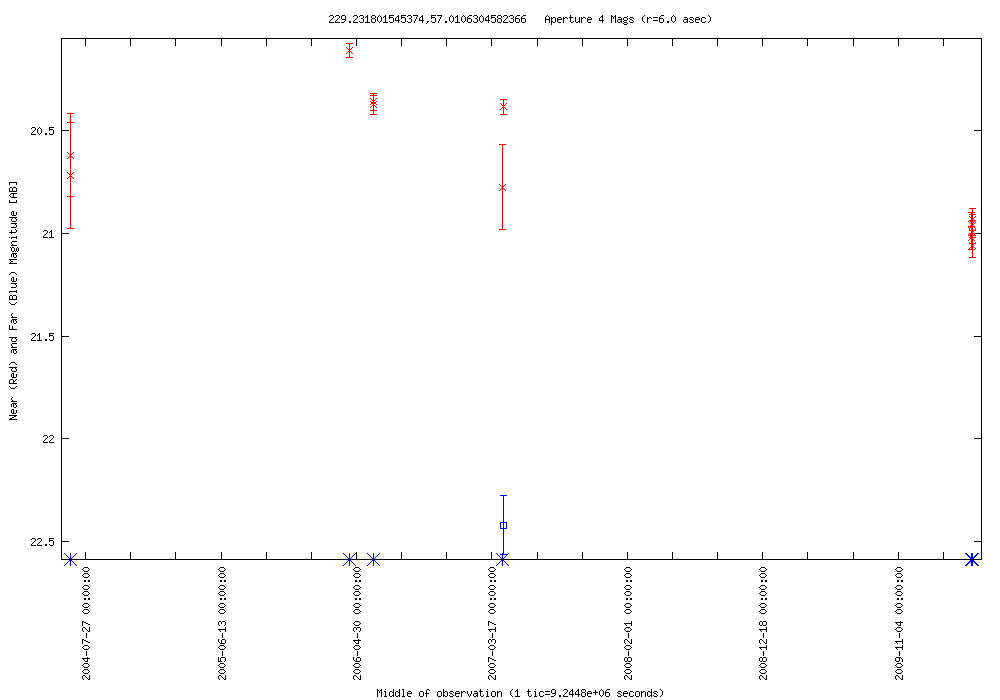
| 2010-04-27 11:12:42-07 | 229.23180 +57.01063 | 0.948 | 20.112 | 10 | 0.000 | 22.419 | 1 | QSO | SDSS J151655.59+570038.5 | z=1.51 | NED Simbad SDSS |  |
LC Plot |
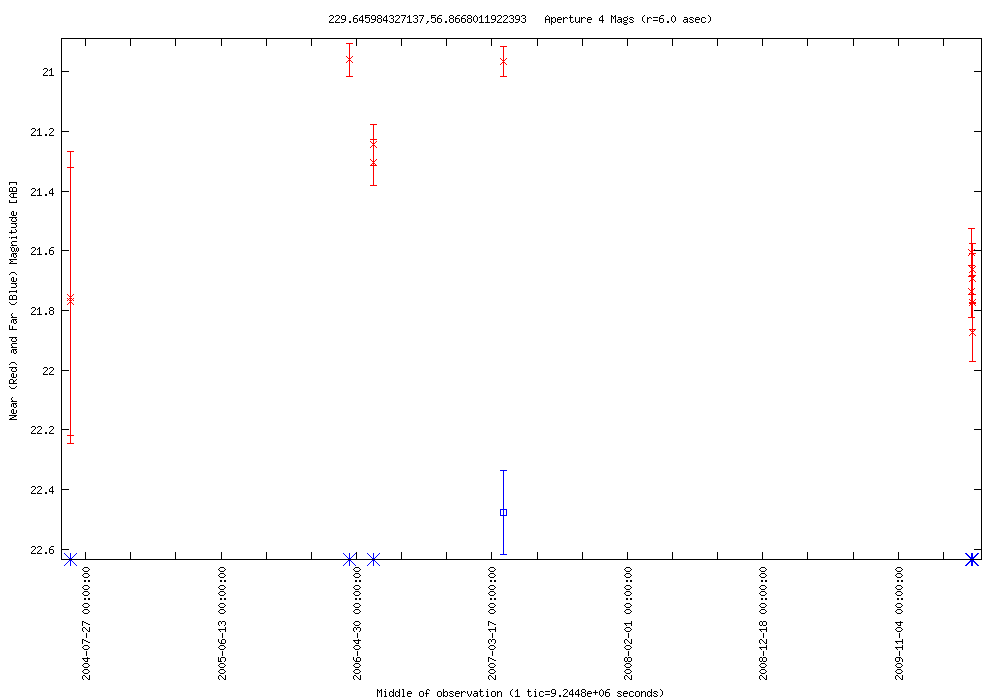
| 2010-04-27 11:12:42-07 | 229.64598 +56.86680 | 0.912 | 20.960 | 10 | 0.000 | 22.477 | 1 | UvES | SDSS J151835.04+565200.1 | SDSS classified as a star | NED Simbad SDSS |  |
LC Plot |
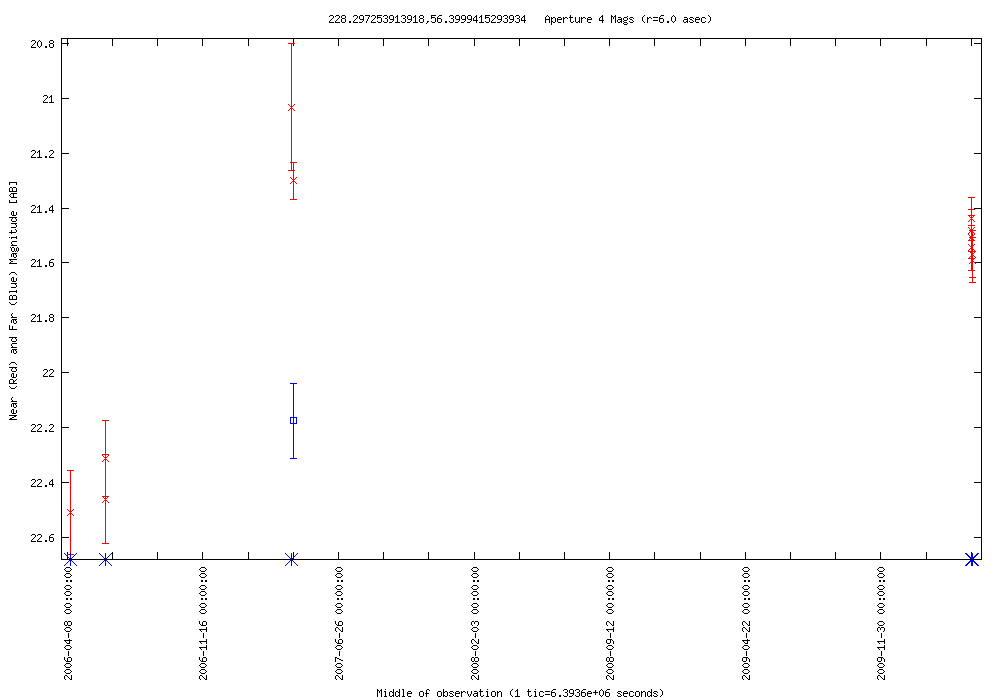
| 2010-04-27 11:12:42-07 | 228.29725 +56.39994 | 1.208 | 21.301 | 10 | 0.000 | 22.175 | 1 | AGN? | SDSS J151311.36+562359.6 | SDSS classified as a galaxy | NED Simbad SDSS |  |
LC Plot |
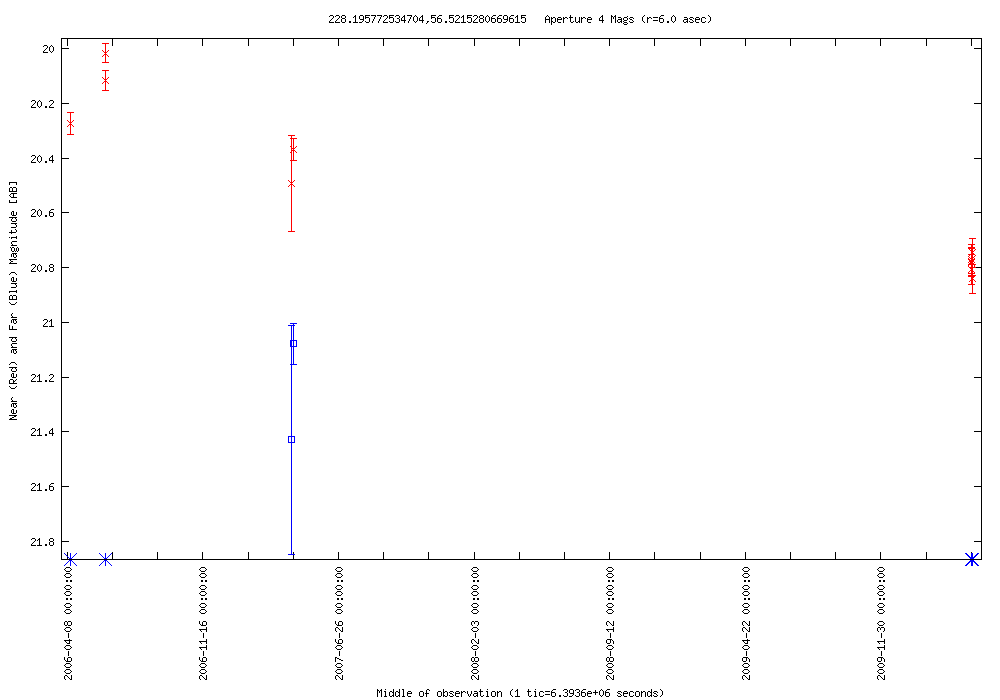
| 2010-04-27 11:12:42-07 | 228.19577 +56.52153 | 0.825 | 20.016 | 10 | 0.000 | 21.078 | 1 | QSO | SDSS J151246.89+563117.2 | z=1.58 | NED Simbad SDSS |  |
LC Plot |
| 2010-04-27 04:38:09-07 | 181.95756 +12.99347 | 1.656 | 19.674 | 5 | 0.000 | 0.000 | 0 | Flare star? | SDSS J120749.74+125937.1 | red star | NED Simbad SDSS | |
LC Plot |
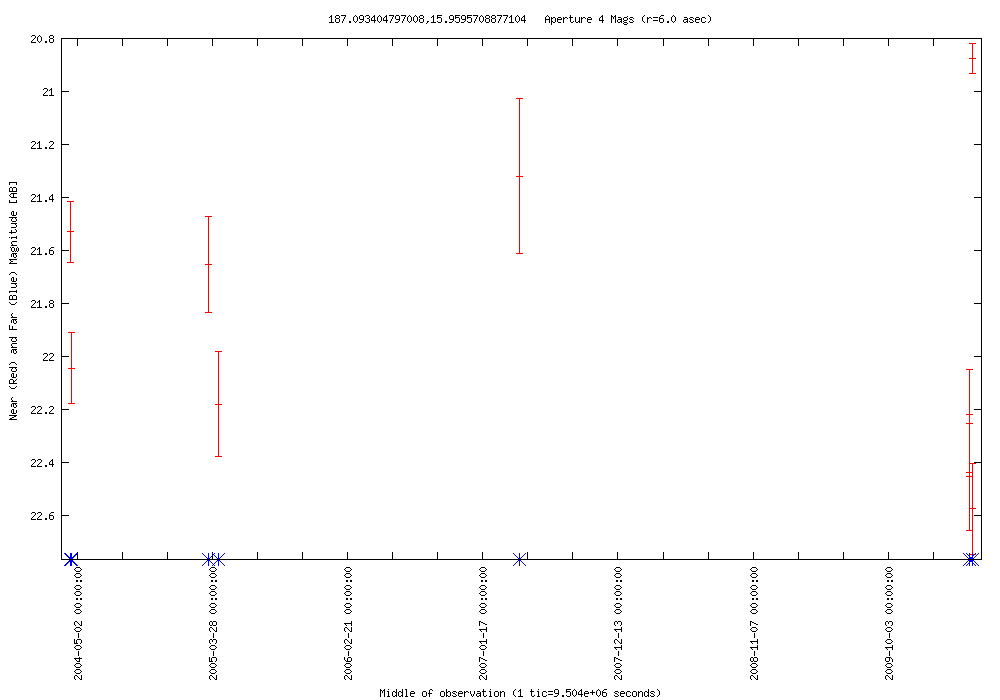
| 2010-04-27 02:59:31-07 | 187.09340 +15.95957 | 1.698 | 20.877 | 4 | 0.000 | 0.000 | 0 | AGN? | SDSS J122822.38+155733.5 | blue, stellar | NED Simbad SDSS |  |
LC Plot |
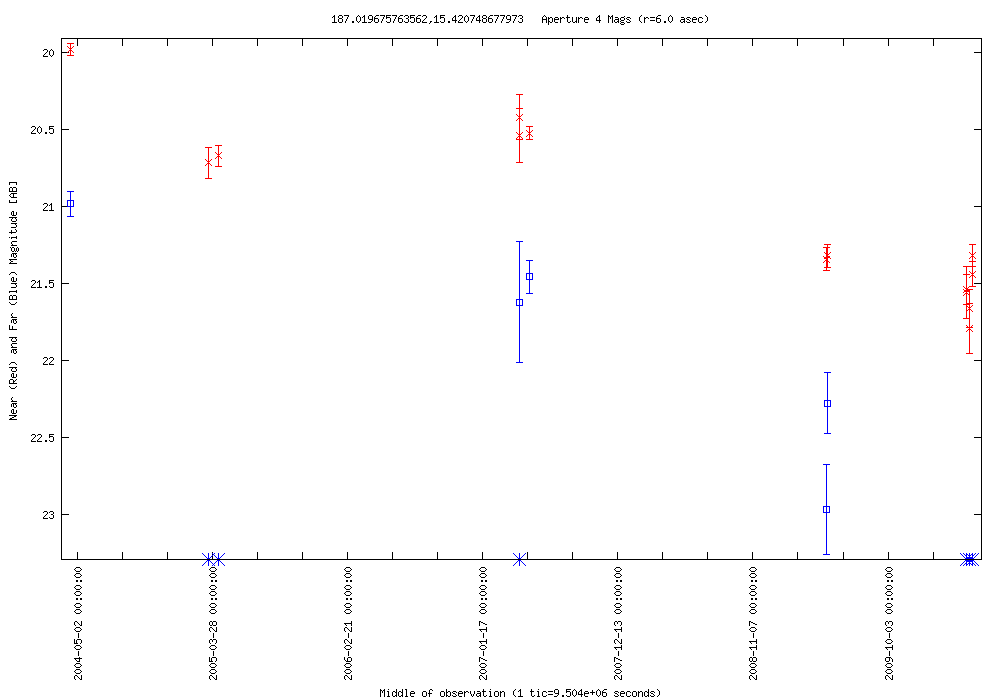
| 2010-04-27 02:59:31-07 | 187.01968 +15.42075 | 1.812 | 19.980 | 12 | 1.986 | 20.983 | 4 | AGN? | SDSS J122804.62+152513.2 | SDSS classified as a star | NED Simbad SDSS |  |
LC Plot |
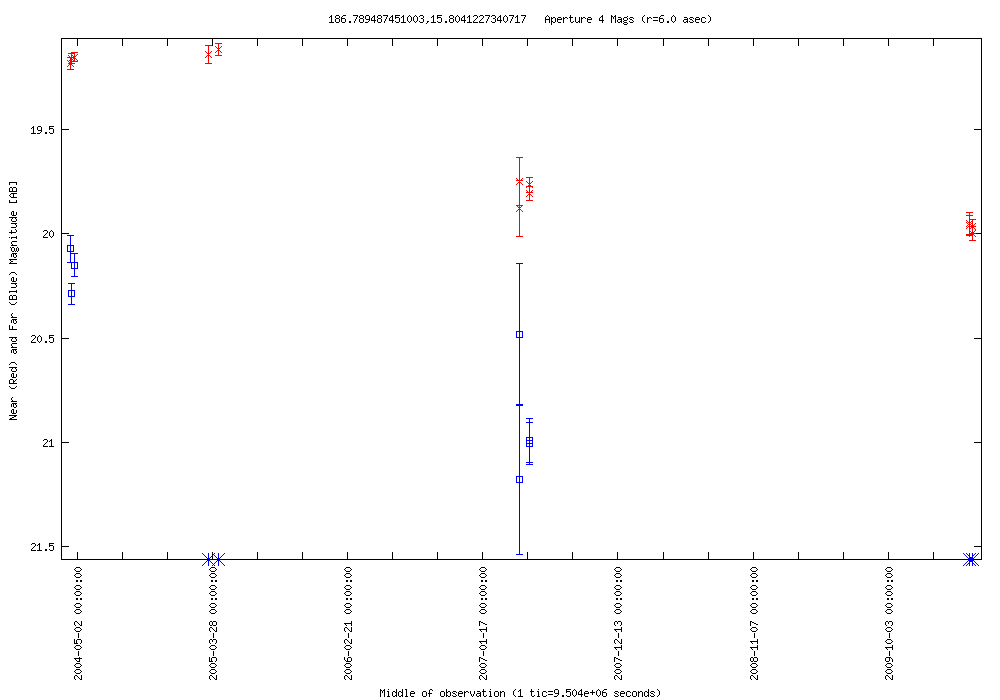
| 2010-04-26 23:42:14-07 | 186.78949 +15.80412 | 0.882 | 19.117 | 11 | 0.932 | 20.073 | 5 | QSO | LBQS 1224+1604 | z=0.53 | NED Simbad SDSS |  |
LC Plot |
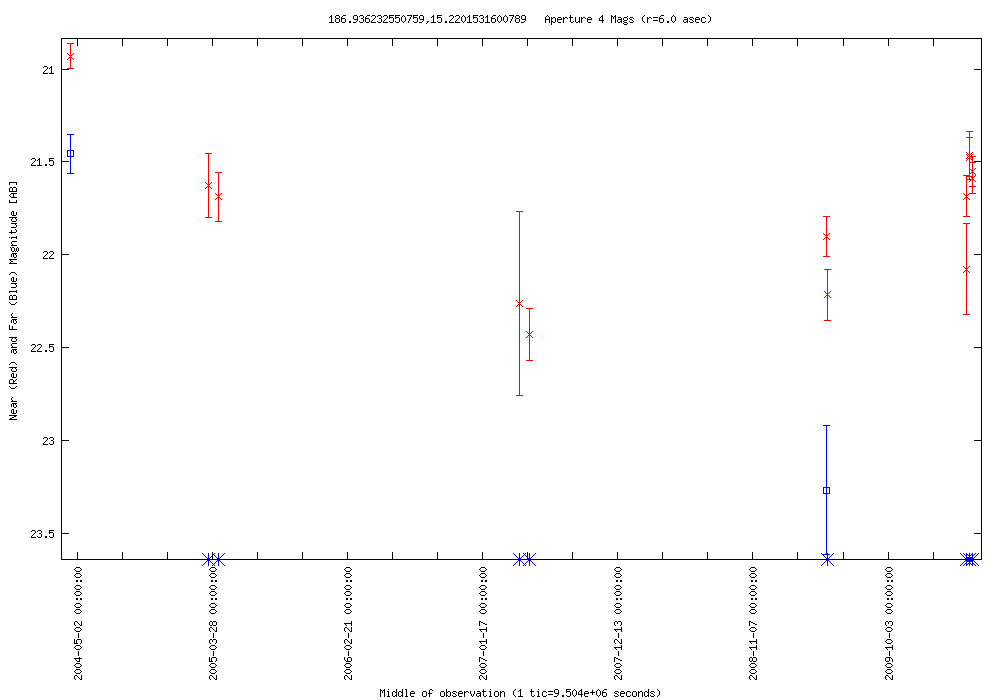
| 2010-04-26 23:42:14-07 | 186.93623 +15.22015 | 1.500 | 20.929 | 12 | 1.812 | 21.456 | 2 | AGN? | SDSS J122744.66+151312.6 | SDSS classified as a star | NED Simbad SDSS |  |
LC Plot |
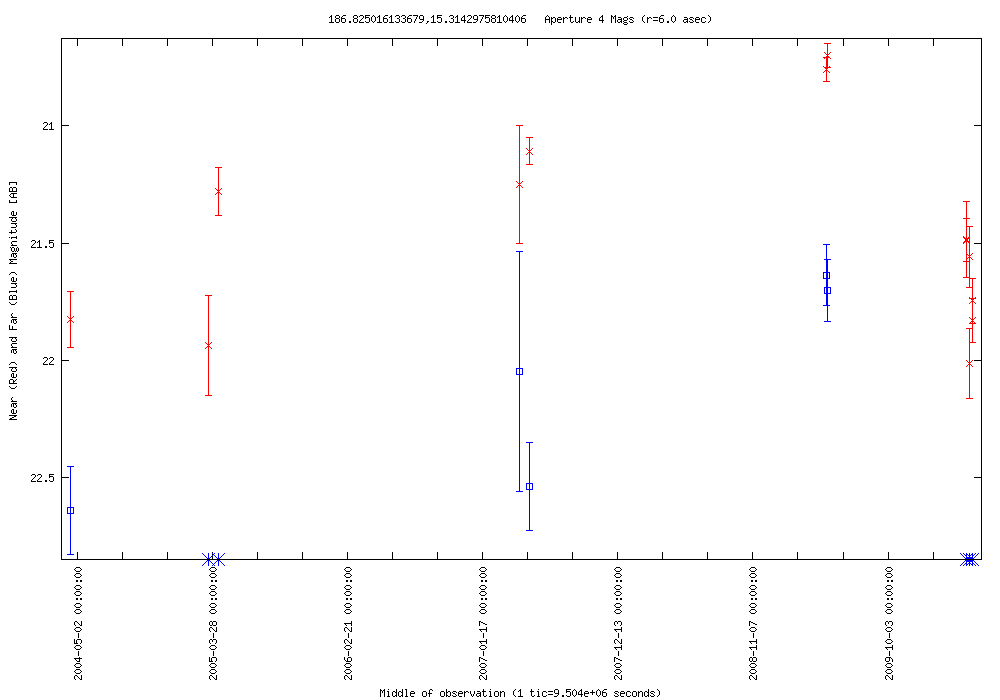
| 2010-04-26 23:42:14-07 | 186.82502 +15.31430 | 1.311 | 20.702 | 12 | 1.001 | 21.637 | 4 | AGN? | SDSS J122717.84+151850.3 | SDSS classified as a galaxy | NED Simbad SDSS |  |
LC Plot |
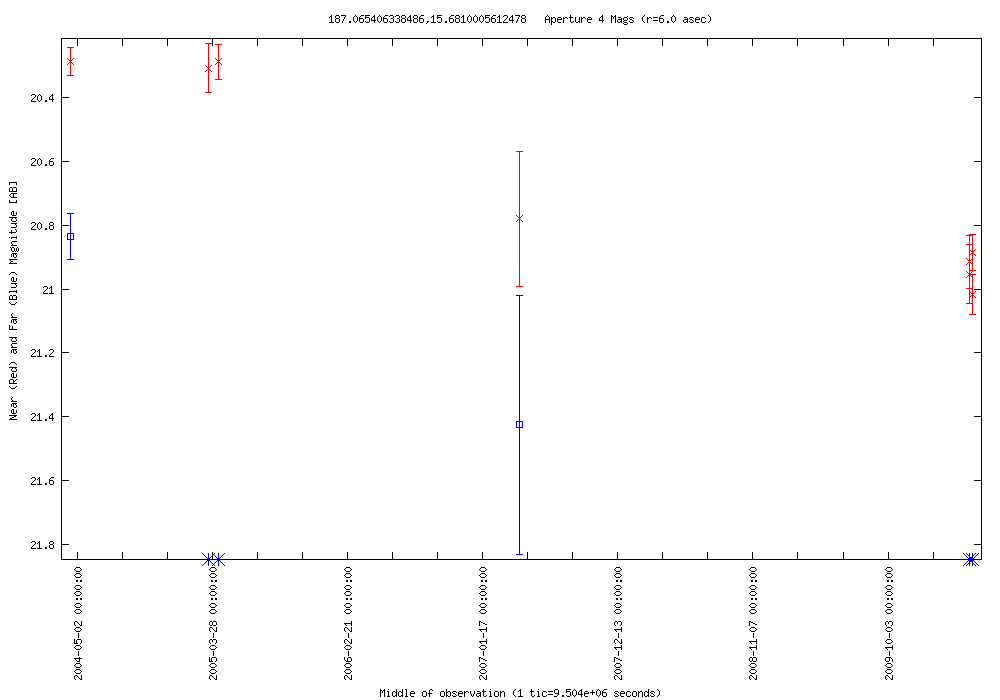
| 2010-04-26 23:42:14-07 | 187.06541 +15.68100 | 0.730 | 20.287 | 7 | 0.000 | 20.836 | 1 | AGN? | SDSS J122815.73+154052.0 | SDSS classified as a galaxy | NED Simbad SDSS |  |
LC Plot |
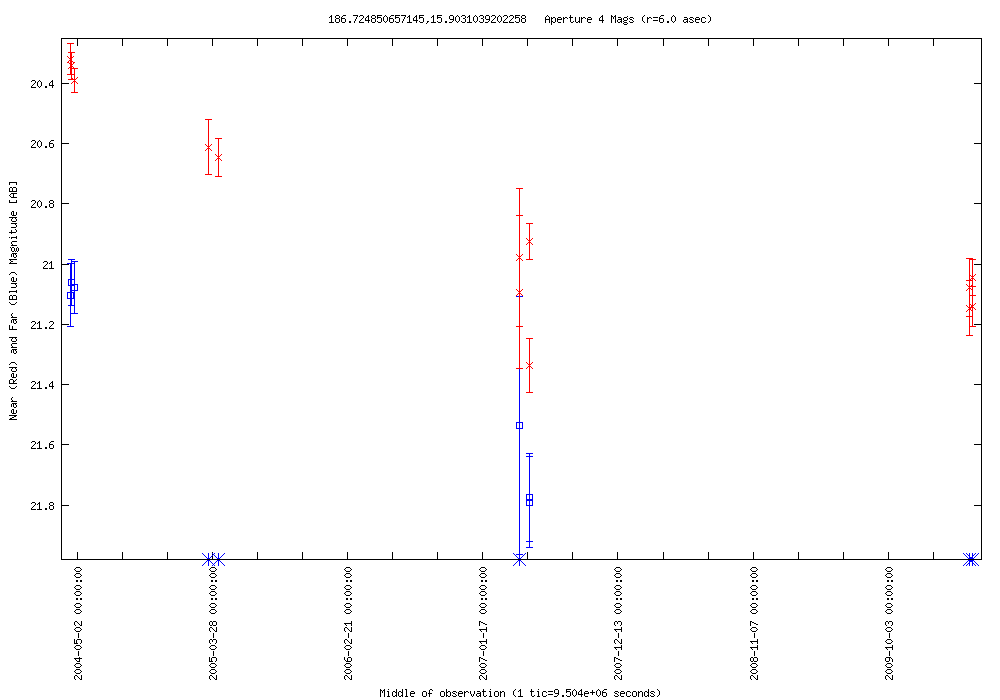
| 2010-04-26 23:42:14-07 | 186.72485 +15.90310 | 1.017 | 20.320 | 11 | 0.728 | 21.062 | 5 | AGN? | SDSS J122653.97+155411.1 | blue, stellar | NED Simbad SDSS |  |
LC Plot |
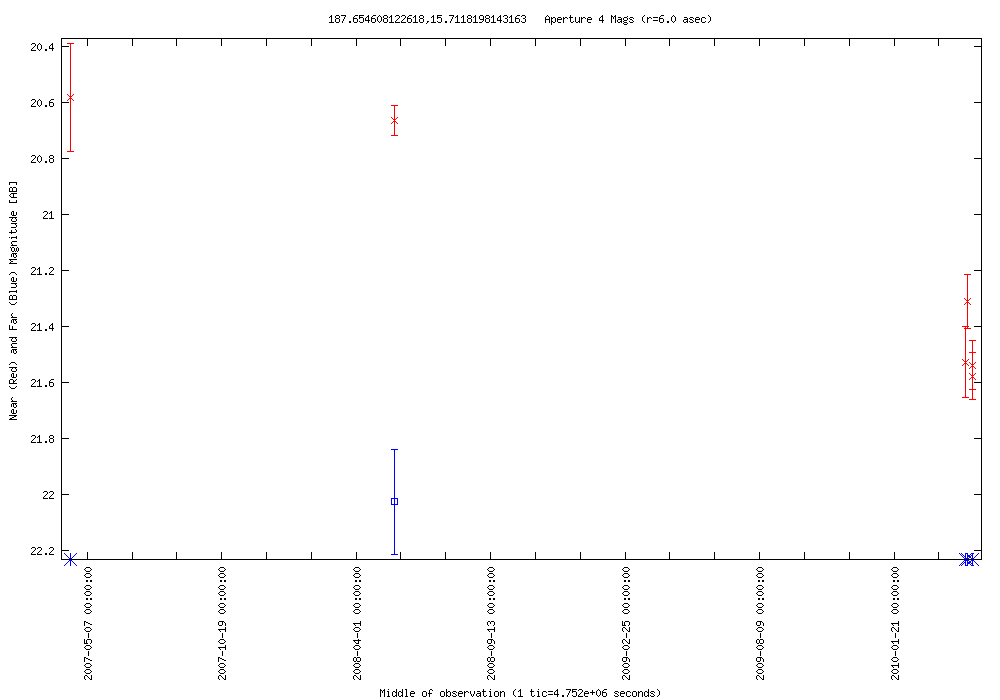
| 2010-04-26 23:42:14-07 | 187.65461 +15.71182 | 0.913 | 20.665 | 5 | 0.000 | 22.028 | 1 | AGN? | SDSS J123037.17+154242.4 | SDSS classified as a galaxy | NED Simbad SDSS |  |
LC Plot |
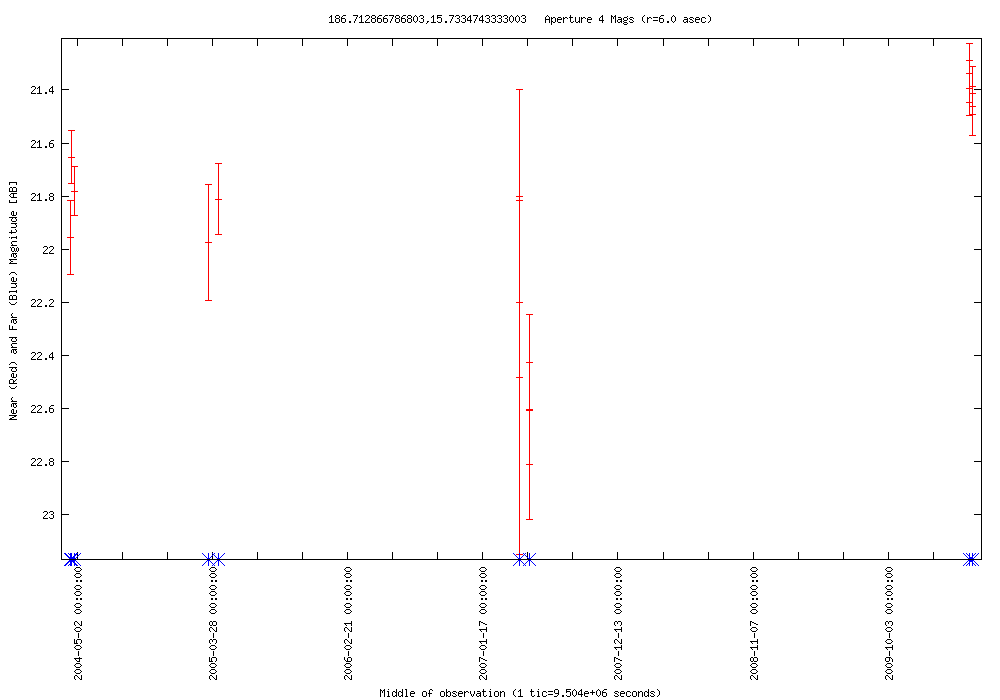
| 2010-04-26 23:42:14-07 | 186.71287 +15.73347 | 1.474 | 21.336 | 11 | 0.000 | 0.000 | 0 | AGN? | SDSS J122651.05+154400.2 | blue, stellar | NED Simbad SDSS |  |
LC Plot |
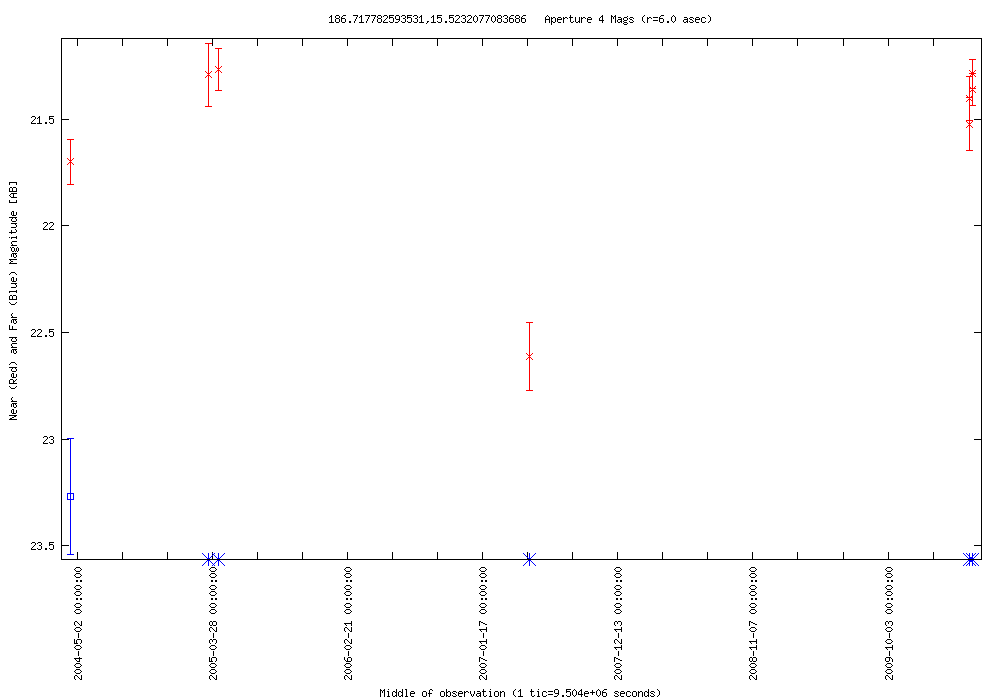
| 2010-04-26 23:42:14-07 | 186.71778 +15.52321 | 1.344 | 21.269 | 8 | 0.000 | 23.269 | 1 | AGN? | SDSS J122652.27+153122.2 | SDSS classified as a galaxy | NED Simbad SDSS |  |
LC Plot |
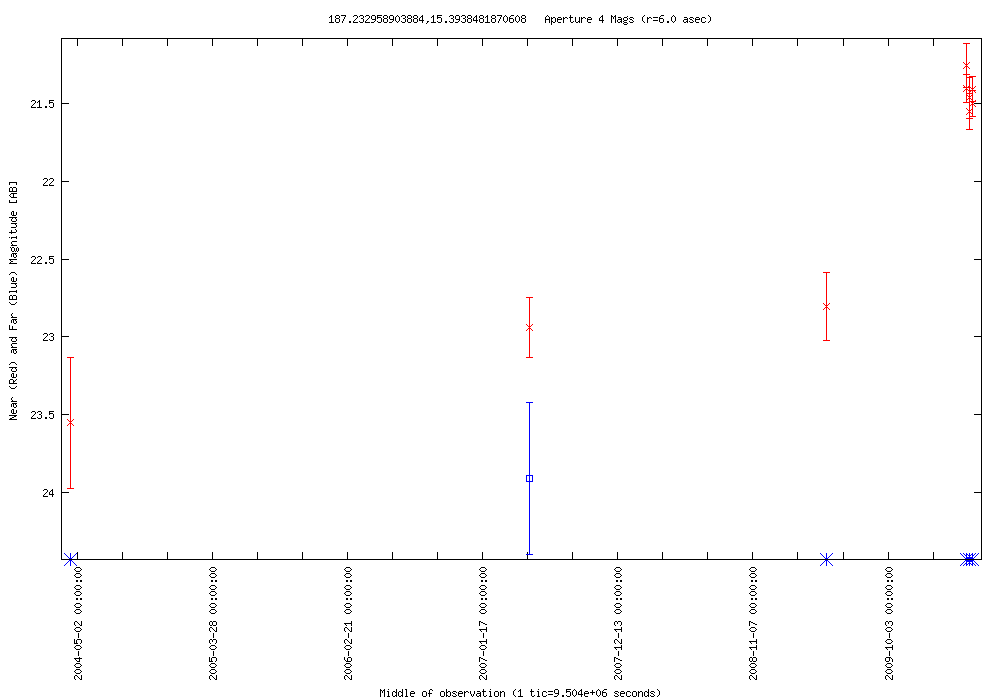
| 2010-04-26 23:42:14-07 | 187.23296 +15.39385 | 1.690 | 21.253 | 9 | 0.376 | 23.535 | 2 | AGN? | SDSS J122856.01+152338.6 | SDSS classified as a galaxy | NED Simbad SDSS |  |
LC Plot |
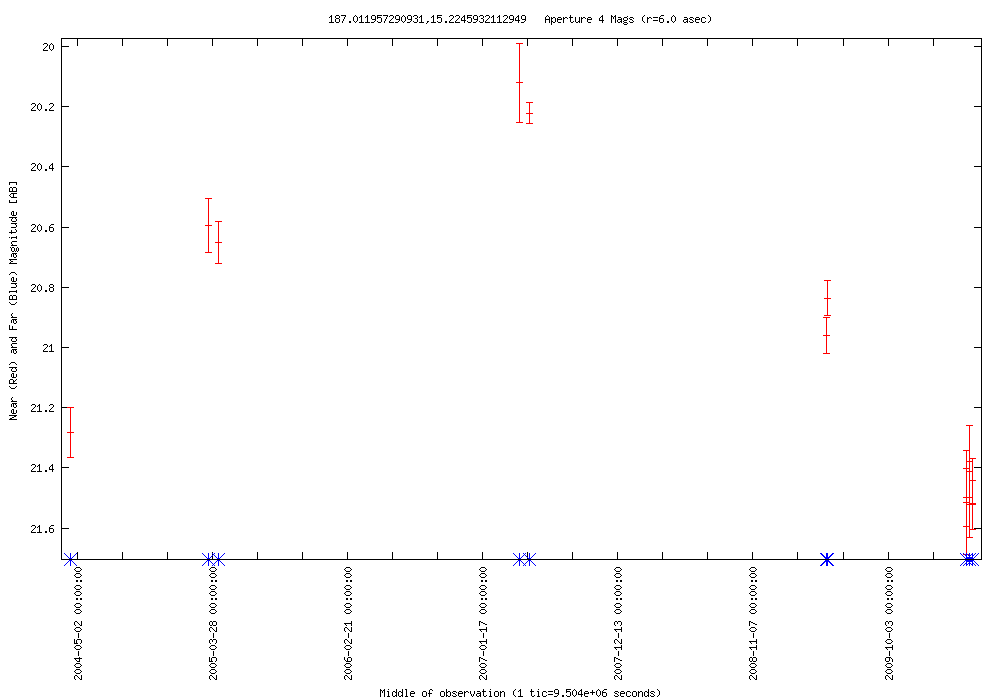
| 2010-04-26 23:42:14-07 | 187.01196 +15.22459 | 1.301 | 20.222 | 12 | 0.000 | 0.000 | 0 | QSO | SDSS J122802.73+151327.6 | z=1.57 | NED Simbad SDSS |  |
LC Plot |
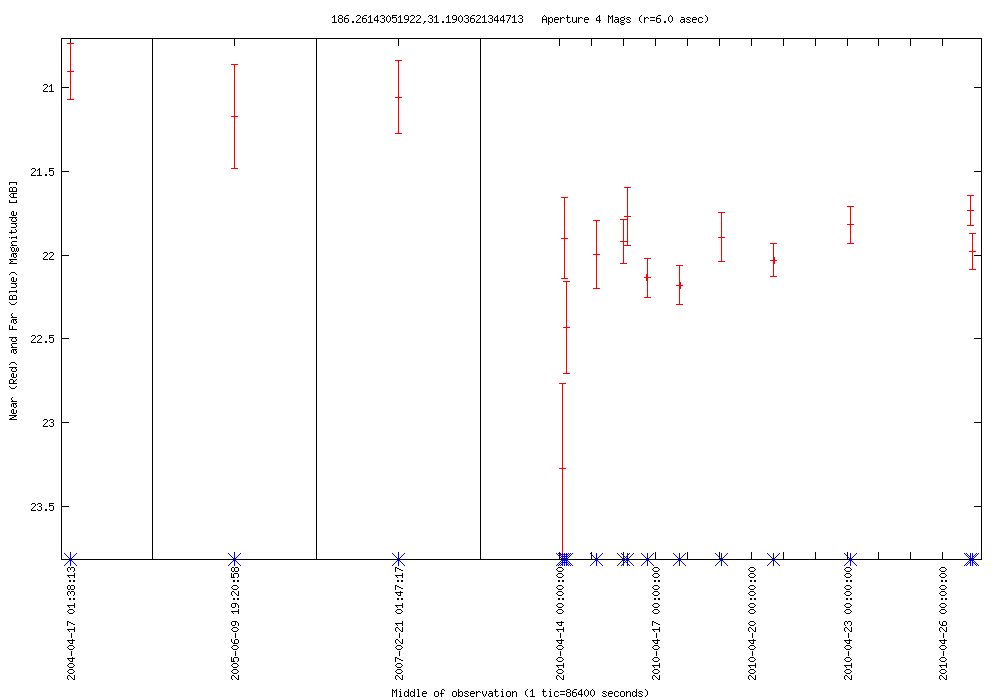
| 2010-04-26 20:24:58-07 | 186.26143 +31.19036 | 2.375 | 20.902 | 14 | 0.000 | 0.000 | 0 | AGN? | SDSS J122502.67+311124.6 | blue, stellar | NED Simbad SDSS |  |
LC Plot |
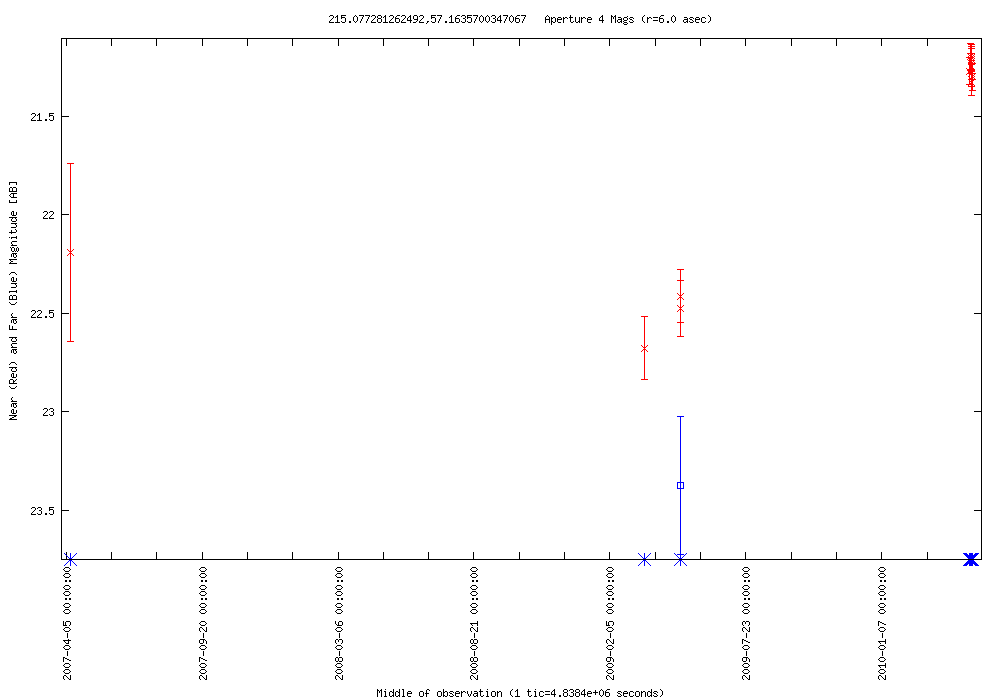
| 2010-04-26 18:46:19-07 | 215.07728 +57.16357 | 1.478 | 21.199 | 12 | 0.000 | 23.375 | 1 | AGN? | SDSS J142018.54+570948.6 | SDSS classified as a star | NED Simbad SDSS |  |
LC Plot |
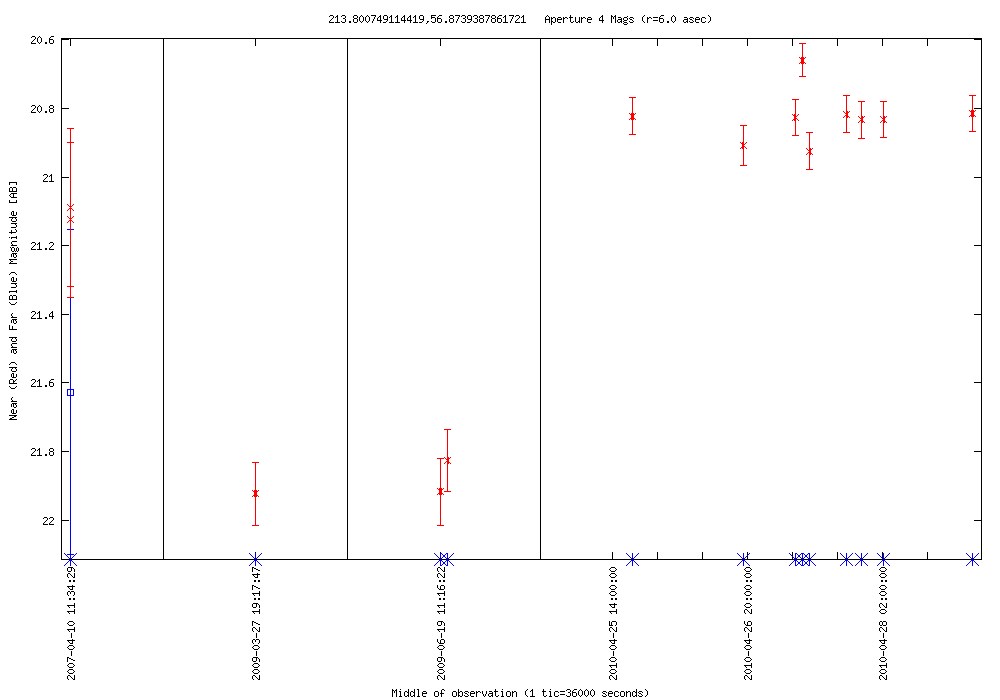
| 2010-04-26 18:46:19-07 | 213.80075 +56.87394 | 1.264 | 20.659 | 12 | 0.000 | 0.000 | 0 | AGN? | SDSS J141512.05+565225.3 | SDSS classified as a star | NED Simbad SDSS |  |
LC Plot |
| 2010-04-26 15:29:03-07 | 212.85706 +52.82344 | 1.930 | 21.245 | 15 | 0.000 | 0.000 | 0 | Radio Source, AGN? | SDSS J141125.70+524924.2 | SDSS classified as a galaxy | NED Simbad SDSS | |
LC Plot |
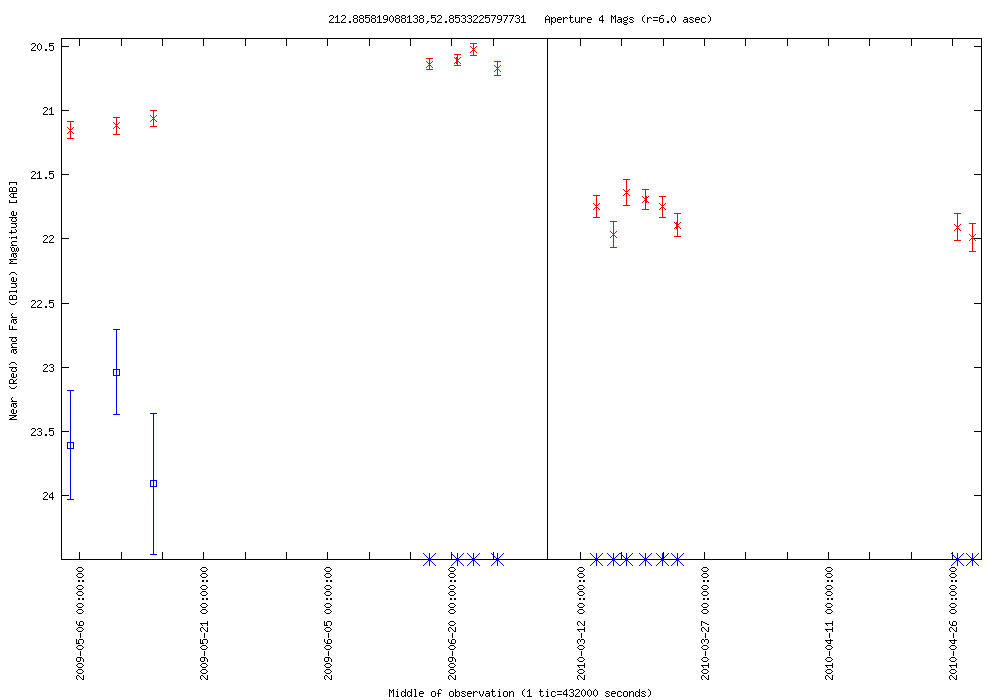
| 2010-04-26 15:29:03-07 | 212.88582 +52.85332 | 1.465 | 20.525 | 15 | 0.869 | 23.036 | 3 | AGN? | SDSS J141132.55+525111.5 | SDSS classified as a star | NED Simbad SDSS |  |
LC Plot |
| 2010-04-26 13:50:25-07 | 214.01970 +52.46411 | 1.572 | 19.267 | 12 | 0.932 | 21.962 | 2 | DN? | SDSS J141604.60+522750.0 | caught one eruption | NED Simbad SDSS | |
LC Plot |
| 2010-04-26 13:50:25-07 | 214.39528 +52.46967 | 2.736 | 20.879 | 208 | 2.073 | 22.196 | 60 | AGN? | SDSS J141734.84+522810.7 | SDSS classified as a star | NED Simbad SDSS | |
LC Plot |
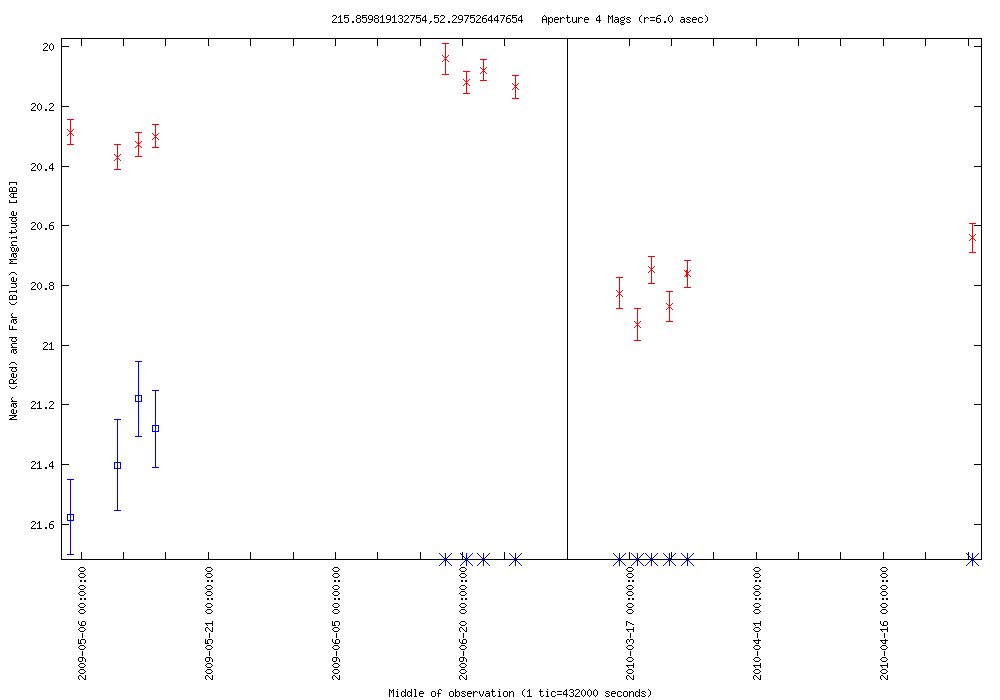
| 2010-04-26 12:11:47-07 | 215.85982 +52.29753 | 0.890 | 20.041 | 14 | 0.396 | 21.181 | 4 | AGN? | SDSS J142326.27+521752.9 | blue, stellar | NED Simbad SDSS |  |
LC Plot |
| 2010-04-26 10:33:09-07 | 212.55525 +54.16973 | 1.221 | 21.266 | 12 | 0.000 | 0.000 | 0 | AGN? | SDSS J141013.32+541012.9 | SDSS classified as a star | NED Simbad SDSS | |
LC Plot |
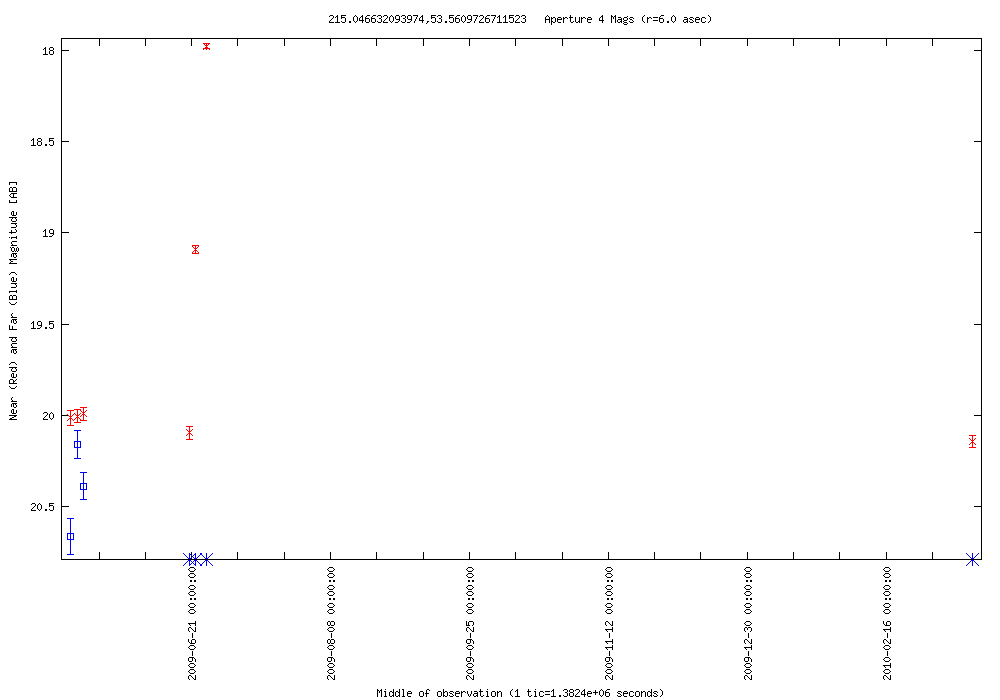
| 2010-04-26 08:54:31-07 | 215.04663 +53.56097 | 2.548 | 17.976 | 12 | 0.504 | 20.161 | 4 | SN | SDSS J142010.86+533342.0 | host galaxy | NED Simbad SDSS |  |
LC Plot |
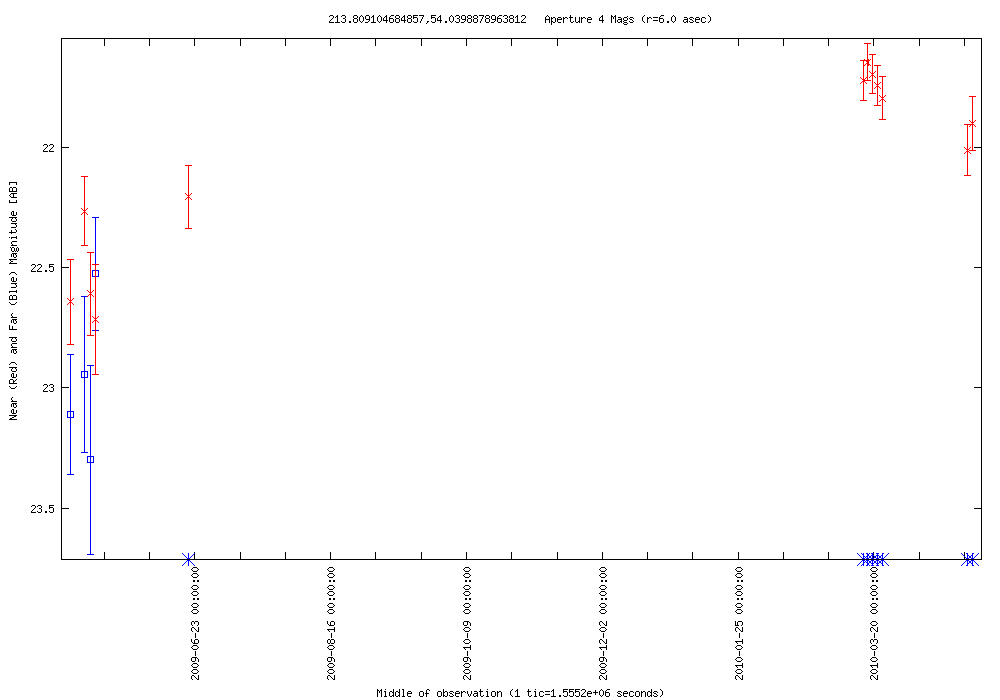
| 2010-04-26 07:15:53-07 | 213.80910 +54.03989 | 1.069 | 21.648 | 11 | 0.773 | 22.526 | 4 | AGN? | SDSS J141514.14+540222.8 | SDSS classified as a star | NED Simbad SDSS |  |
LC Plot |
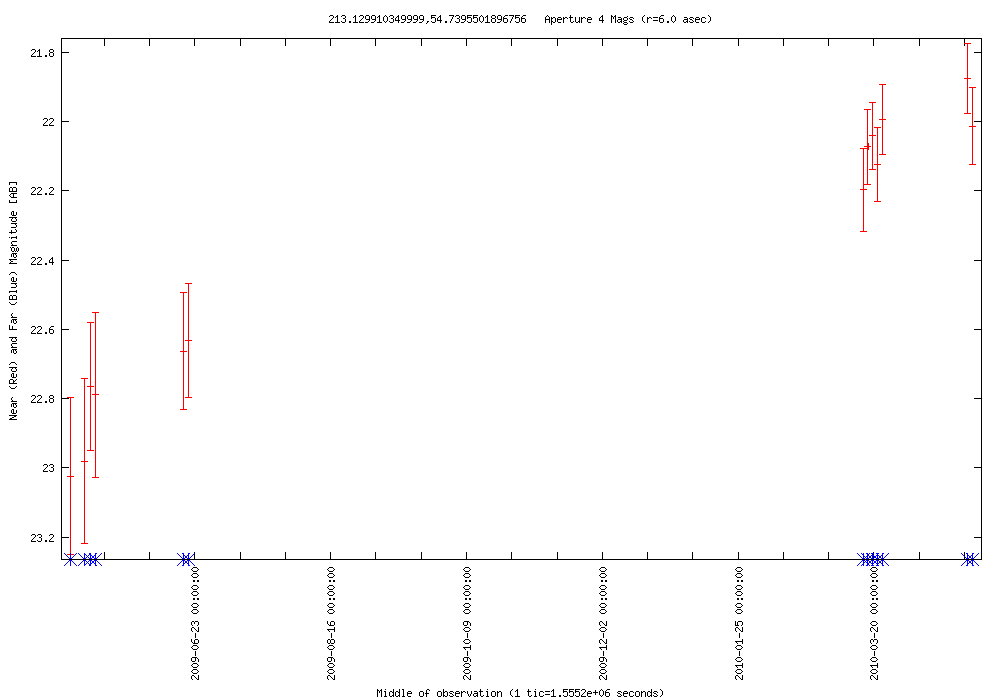
| 2010-04-26 07:15:53-07 | 213.12991 +54.73955 | 1.148 | 21.876 | 12 | 0.000 | 0.000 | 0 | AGN? | SDSS J141231.05+544422.4 | SDSS classified as a star | NED Simbad SDSS |  |
LC Plot |
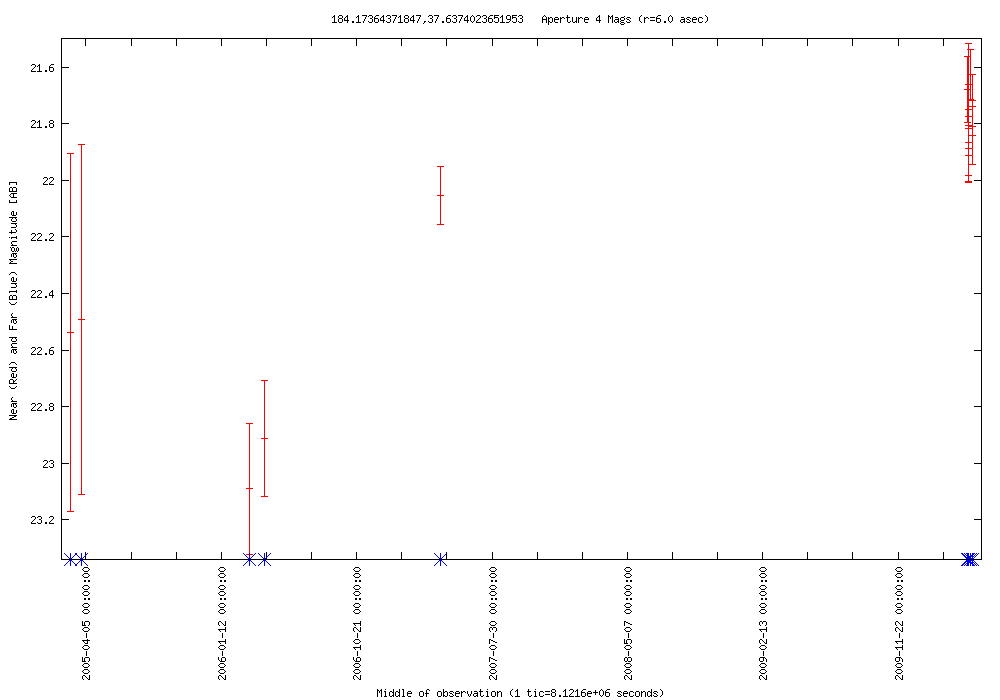
| 2010-04-26 00:41:21-07 | 184.17364 +37.63740 | 1.466 | 21.625 | 11 | 0.000 | 0.000 | 0 | X | CXOSEXSI J121641.4+373814 | SDSS classified as a star | NED Simbad SDSS |  |
LC Plot |
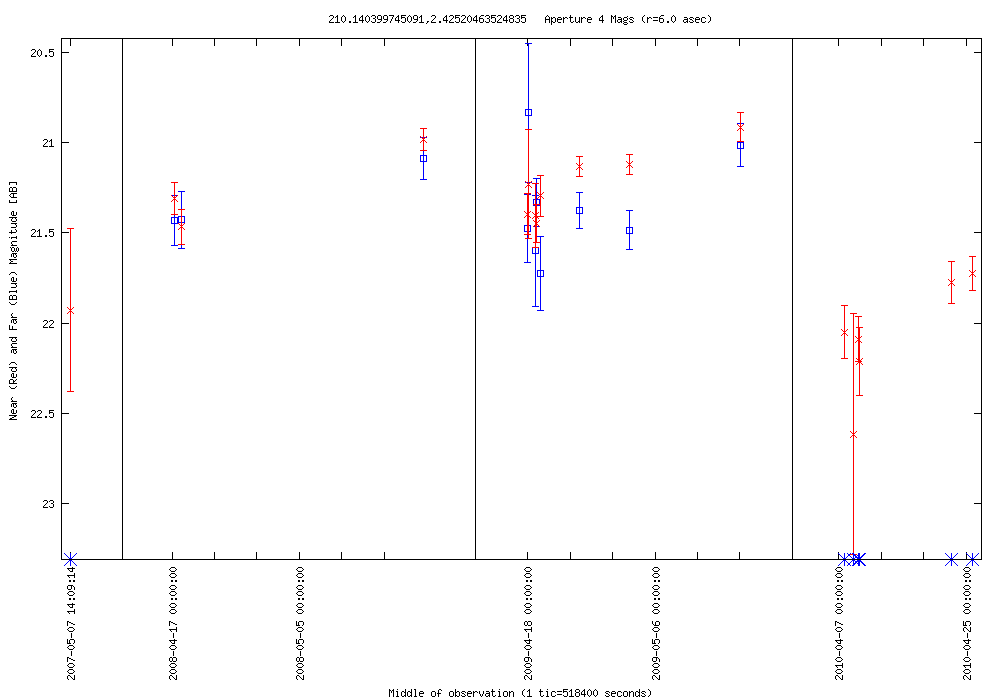
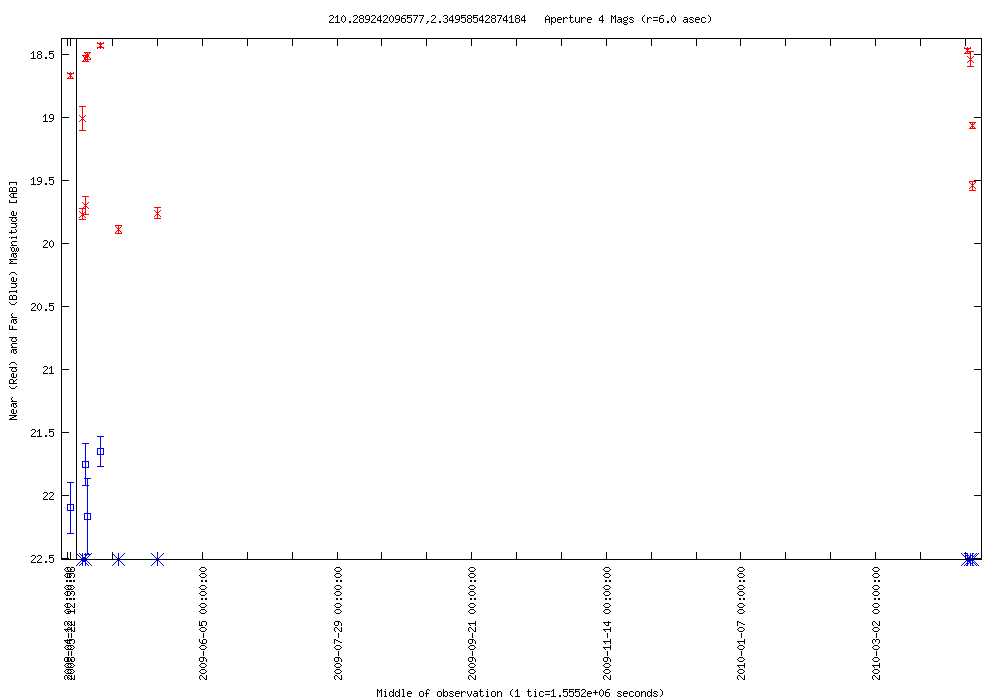
| 2010-04-25 21:24:06-07 | 210.14040 +02.42520 | 1.700 | 20.915 | 15 | 0.888 | 20.837 | 9 | AGN? | SDSS J140033.65+022530.8 | SDSS classified as a galaxy | NED Simbad SDSS |  |
LC Plot |
| 2010-04-25 19:45:28-07 | 181.68409 +51.88800 | 1.432 | 21.565 | 7 | 0.488 | 23.073 | 2 | QSO | SDSS J120644.18+515316.1 | z=2.23 | NED Simbad SDSS | |
LC Plot |
| 2010-04-25 18:06:50-07 | 215.07728 +57.16357 | 1.407 | 21.271 | 4 | 0.000 | 23.375 | 1 | AGN? | SDSS J142018.54+570948.6 | SDSS classified as a star | NED Simbad SDSS | |
LC Plot |
| 2010-04-25 18:06:50-07 | 213.80075 +56.87394 | 1.100 | 20.822 | 4 | 0.000 | 0.000 | 0 | AGN? | SDSS J141512.05+565225.3 | SDSS classified as a star | NED Simbad SDSS | |
LC Plot |
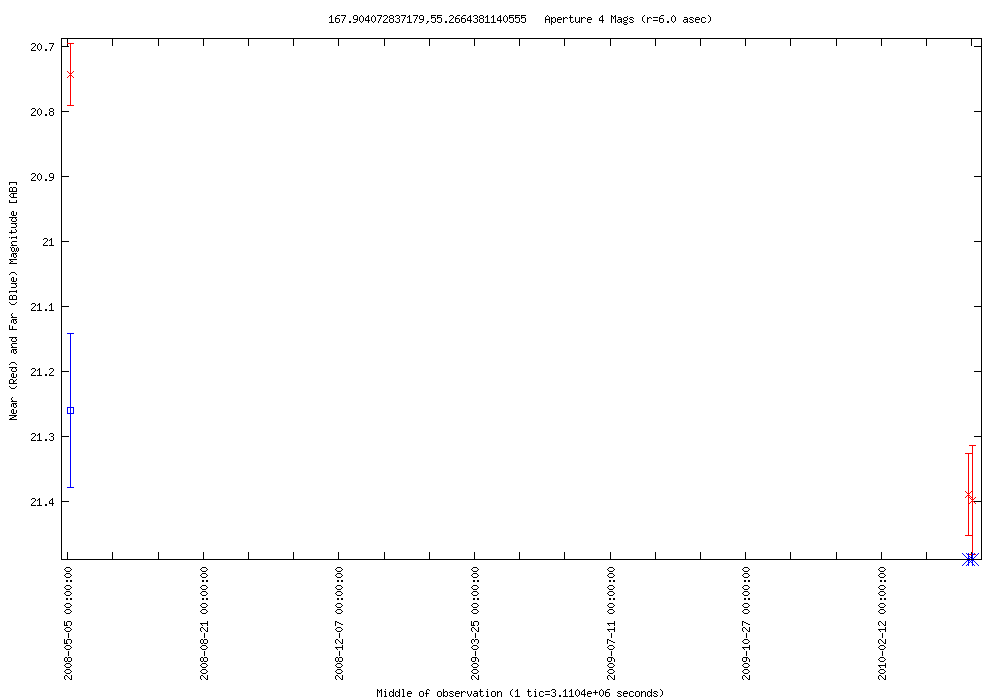
| 2010-04-25 16:28:12-07 | 167.90407 +55.26644 | 0.654 | 20.743 | 3 | 0.000 | 21.260 | 1 | AGN? | SDSS J111136.89+551558.1 | SDSS classified as a star | NED Simbad SDSS |  |
LC Plot |
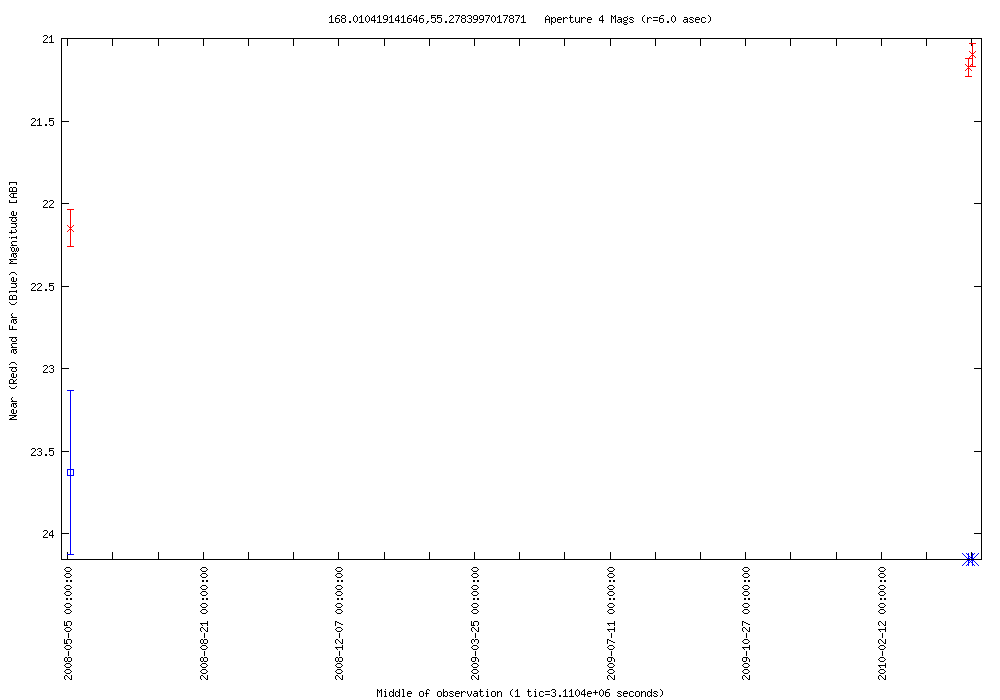
| 2010-04-25 16:28:12-07 | 168.01042 +55.27840 | 1.050 | 21.097 | 3 | 0.000 | 23.629 | 1 | AGN? | SDSS J111202.37+551642.0 | SDSS classified as a star | NED Simbad SDSS |  |
LC Plot |
| 2010-04-25 09:53:42-07 | 214.39528 +52.46967 | 2.736 | 20.879 | 208 | 2.073 | 22.196 | 60 | AGN? | SDSS J141734.84+522810.7 | SDSS classified as a star | NED Simbad SDSS | |
LC Plot |
| 2010-04-25 09:53:42-07 | 214.77156 +52.42461 | 1.645 | 20.213 | 220 | 1.649 | 21.066 | 115 | QSO | SDSS J141905.17+522527.7 | z=1.60 | NED Simbad SDSS | |
LC Plot |
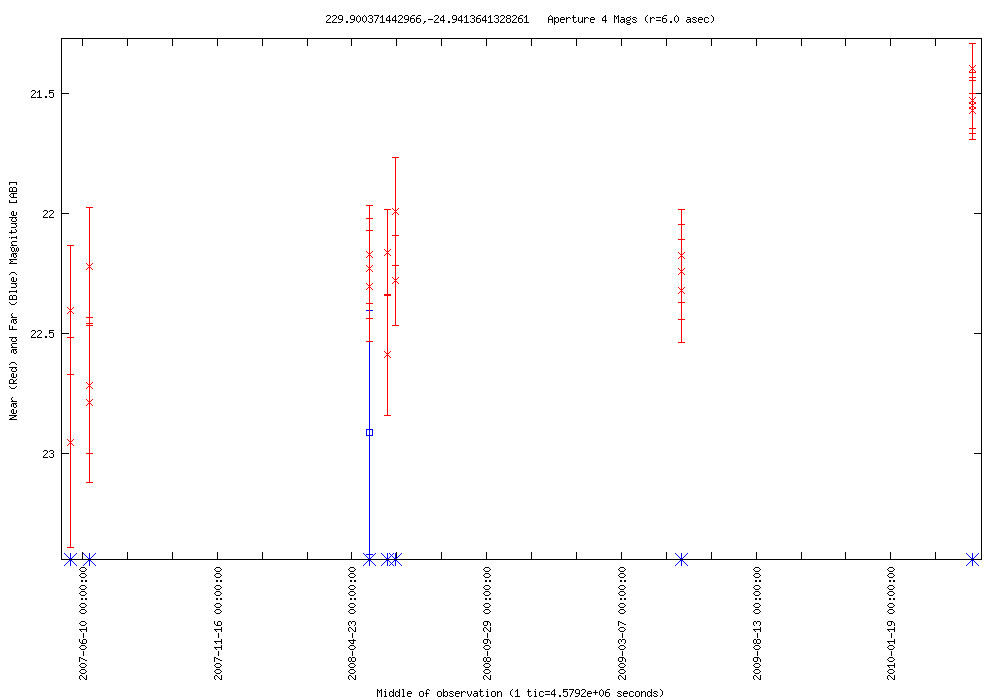
| 2010-04-25 03:19:12-07 | 229.90037 --24.94136 | 1.555 | 21.398 | 19 | 0.000 | 22.911 | 1 | AGN? | - | blue, stellar | NED Simbad SDSS |  |
LC Plot |
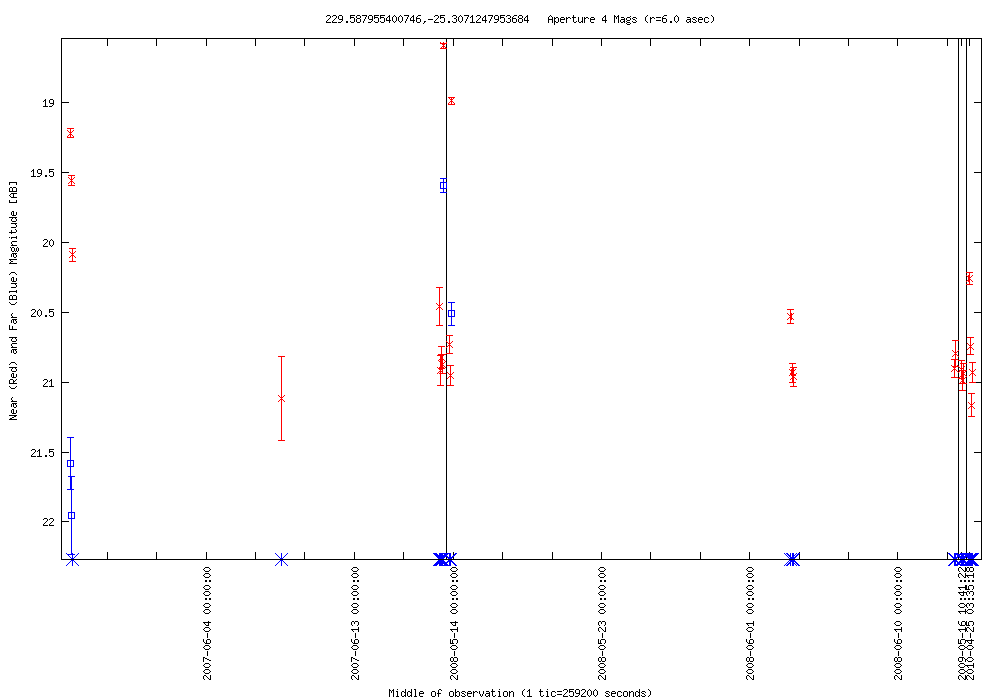
| 2010-04-25 03:19:12-07 | 229.58796 --25.30712 | 2.570 | 18.596 | 23 | 2.360 | 19.593 | 4 | RR Lyrae | AT Lib | blue star | NED Simbad SDSS |  |
LC Plot |
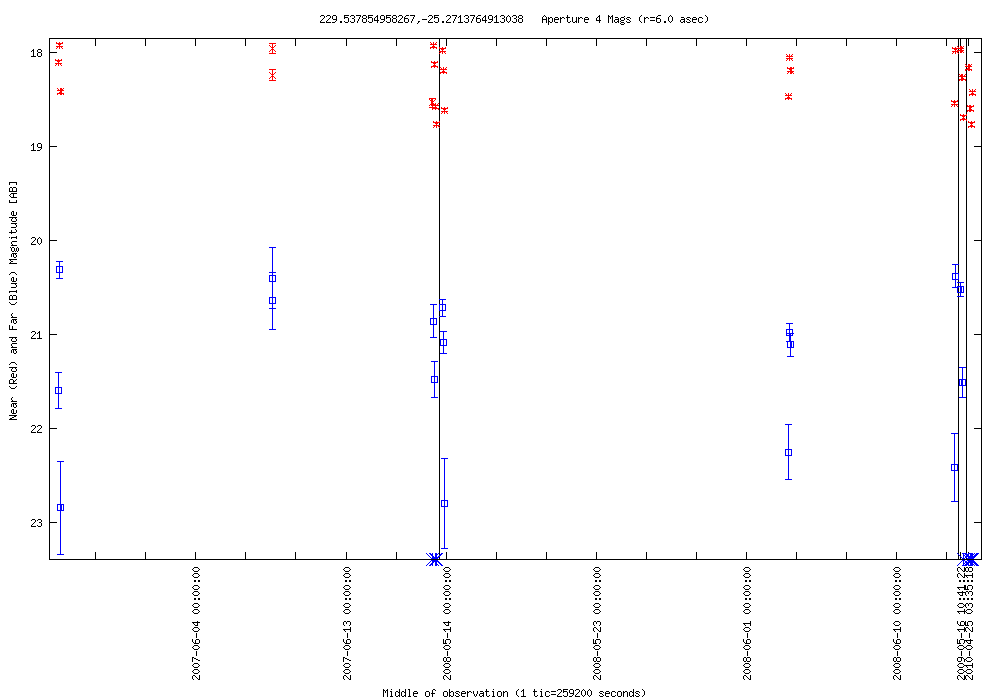
| 2010-04-25 03:19:12-07 | 229.53785 --25.27138 | 0.846 | 17.921 | 23 | 2.534 | 20.315 | 15 | RR Lyrae? | - | blue star | NED Simbad SDSS |  |
LC Plot |
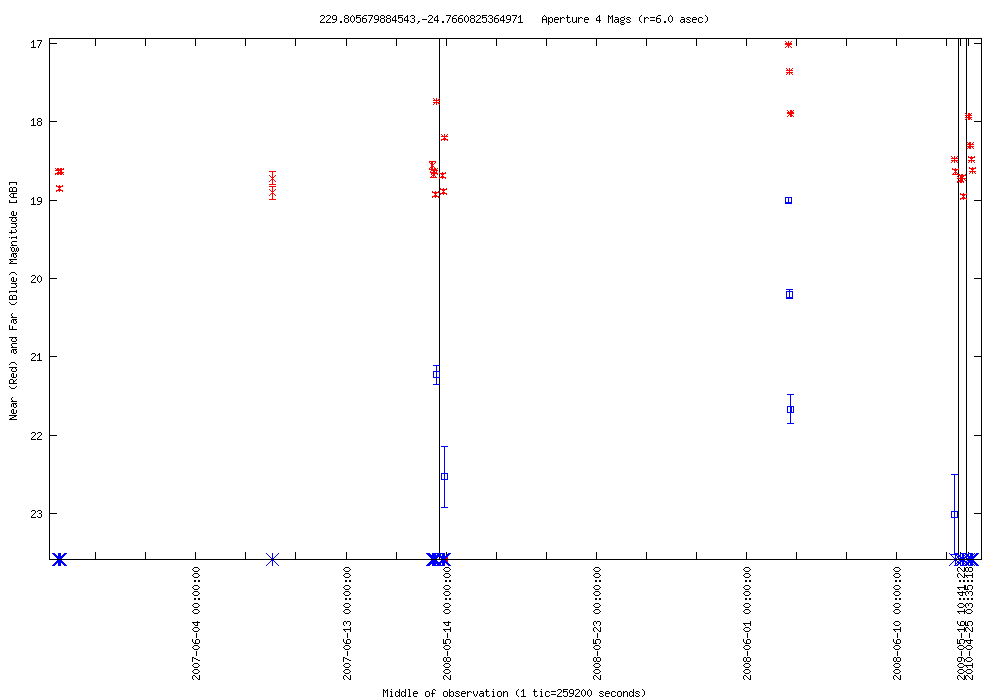
| 2010-04-25 03:19:12-07 | 229.80568 --24.76608 | 1.940 | 17.012 | 23 | 4.009 | 19.003 | 6 | RR Lyrae | AV Lib | blue star | NED Simbad SDSS |  |
LC Plot |
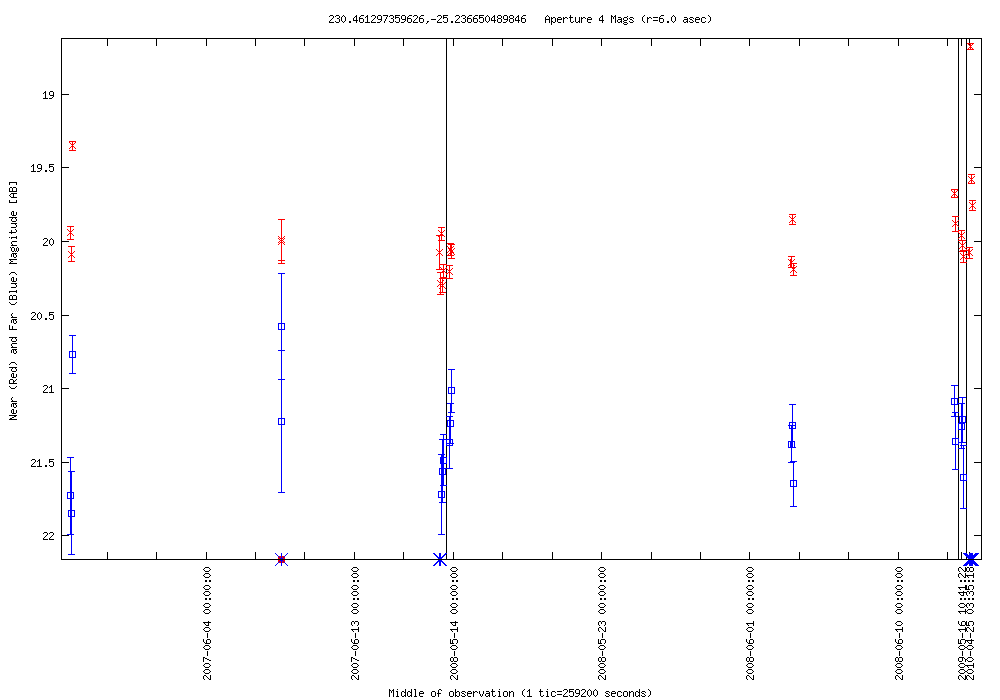
| 2010-04-25 03:19:12-07 | 230.46130 --25.23665 | 1.625 | 18.674 | 23 | 1.076 | 20.771 | 17 | RR Lyrae? | - | blue star | NED Simbad SDSS |  |
LC Plot |
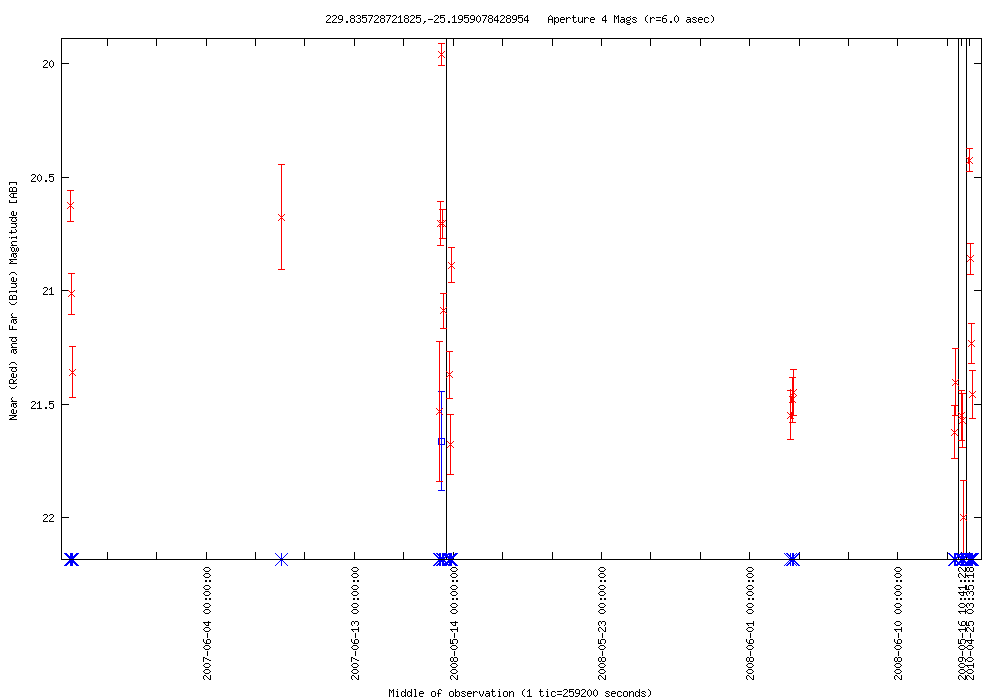
| 2010-04-25 03:19:12-07 | 229.83573 --25.19591 | 2.041 | 19.958 | 23 | 0.000 | 21.663 | 1 | AGN? | - | blue star | NED Simbad SDSS |  |
LC Plot |
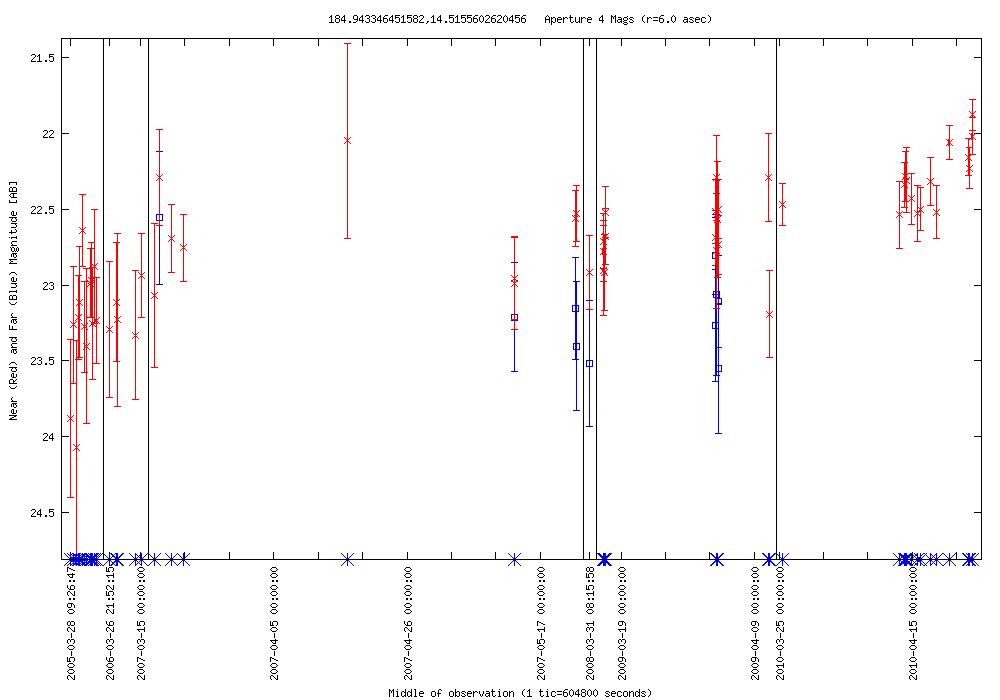
| 2010-04-24 10:53:00-07 | 184.94335 +14.51556 | 2.199 | 21.874 | 58 | 0.994 | 22.556 | 10 | AGN? | SDSS J121946.34+143054.4 | SDSS classified as a star | NED Simbad SDSS |  |
LC Plot |
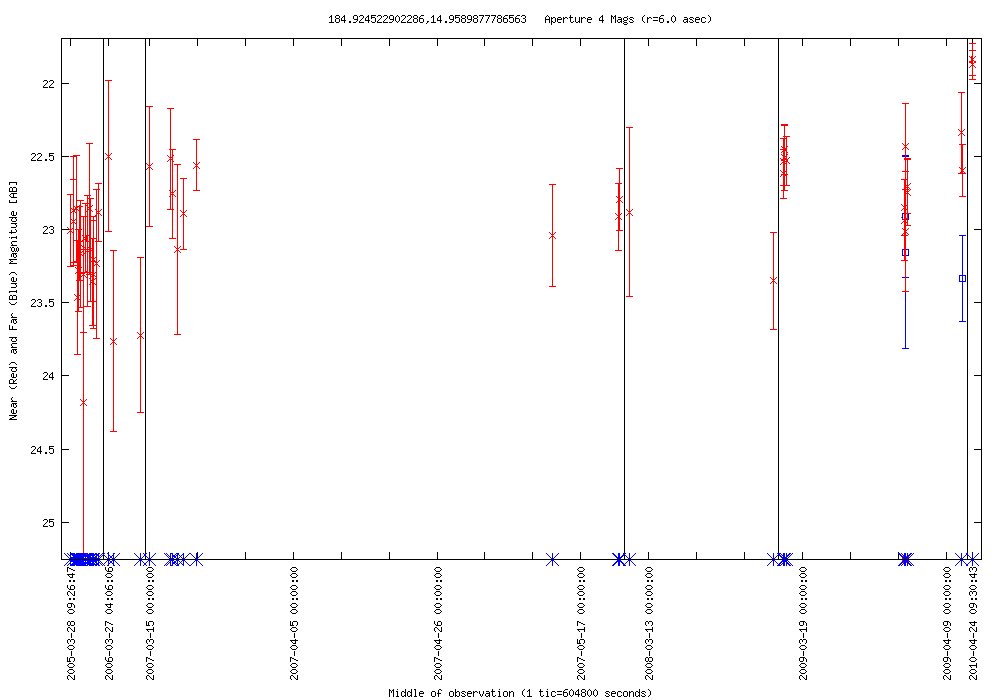
| 2010-04-24 09:14:23-07 | 184.92452 +14.95899 | 2.347 | 21.832 | 48 | 0.424 | 22.907 | 3 | AGN? | SDSS J121941.80+145731.5 | SDSS classified as a star | NED Simbad SDSS |  |
LC Plot |
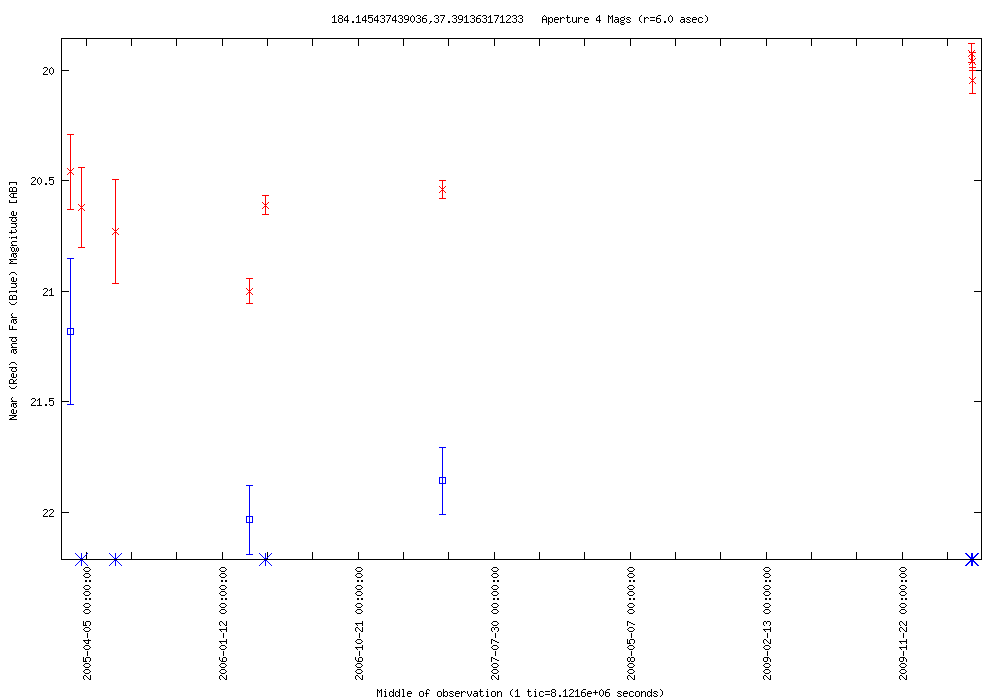
| 2010-04-24 09:14:23-07 | 184.62714 +14.67673 | 1.633 | 19.924 | 60 | 0.596 | 20.703 | 26 | QSO | SDSS J121830.39+144036.2 | z=1.46 | NED Simbad SDSS |  |
LC Plot |
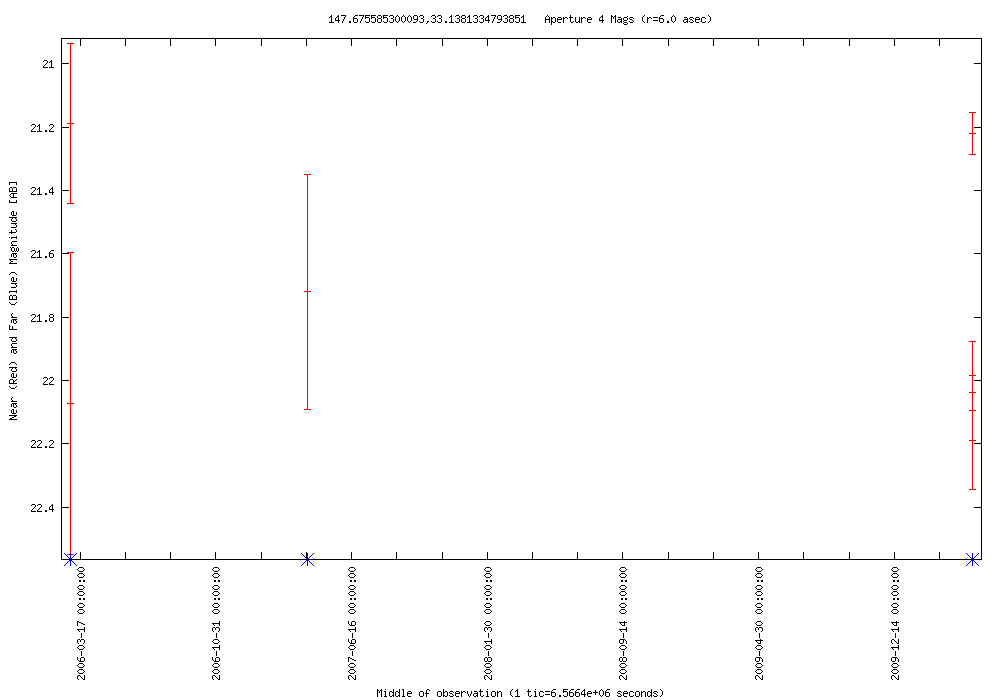
| 2010-04-24 05:57:09-07 | 147.67559 +33.13813 | 0.969 | 21.222 | 3 | 0.000 | 0.000 | 0 | AGN? | SDSS J095041.98+330817.0 | blue star | NED Simbad SDSS |  |
LC Plot |
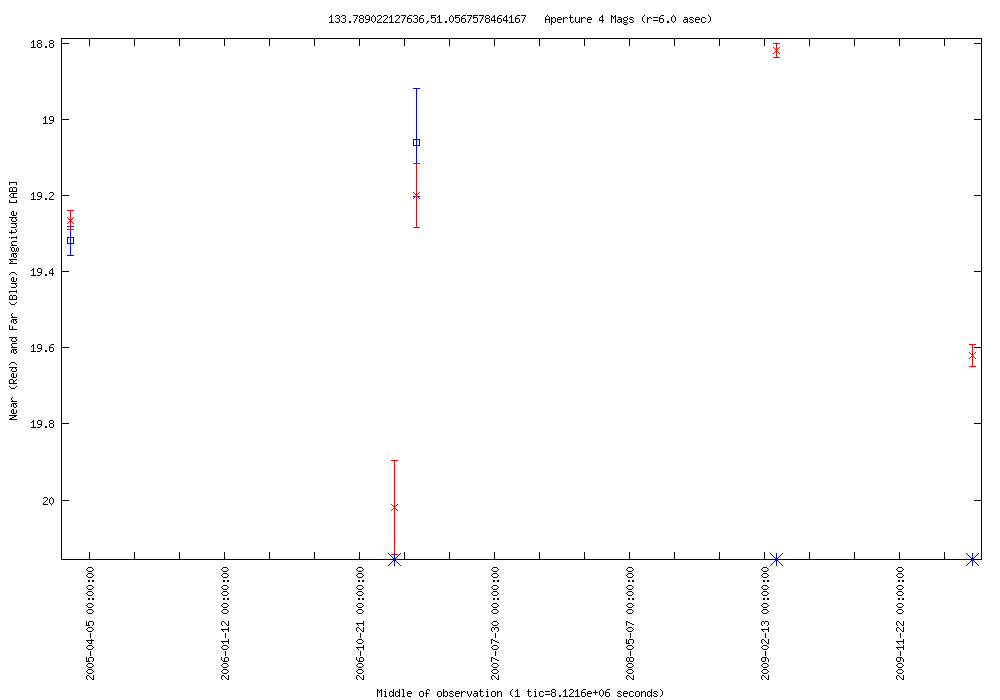
| 2010-04-24 04:18:32-07 | 133.78902 +51.05676 | 0.802 | 18.819 | 3 | 0.000 | 19.319 | 1 | QSO | SDSS J085509.25+510324.1 | z=0.18 | NED Simbad SDSS |  |
LC Plot |
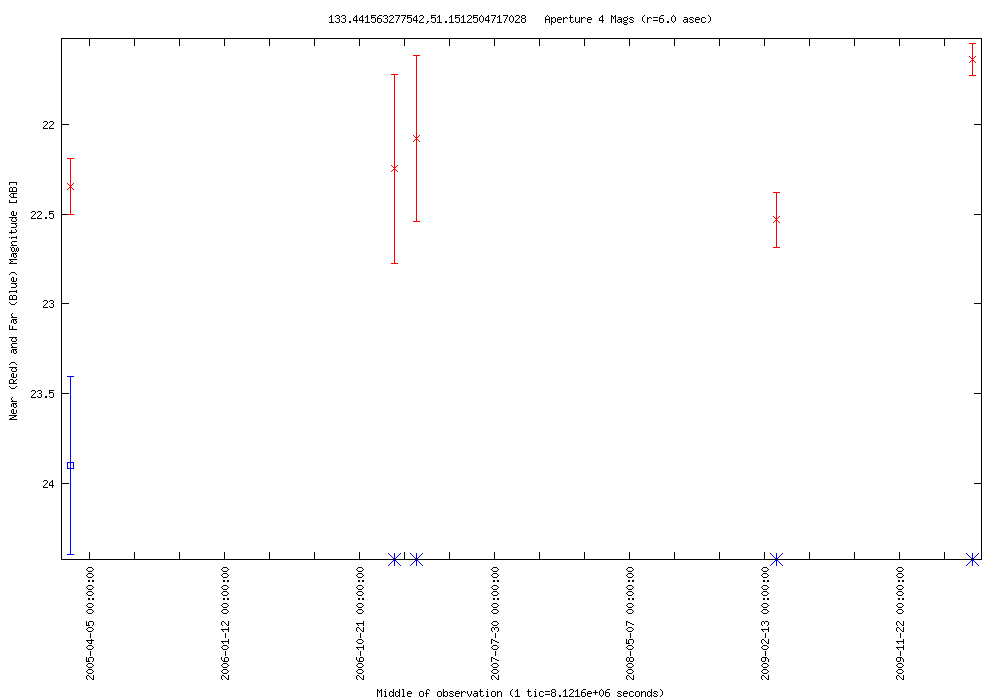
| 2010-04-24 04:18:32-07 | 133.44156 +51.15125 | 0.894 | 21.637 | 3 | 0.000 | 23.901 | 1 | AGN? | SDSS J085345.90+510904.0 | SDSS classified as a star | NED Simbad SDSS |  |
LC Plot |
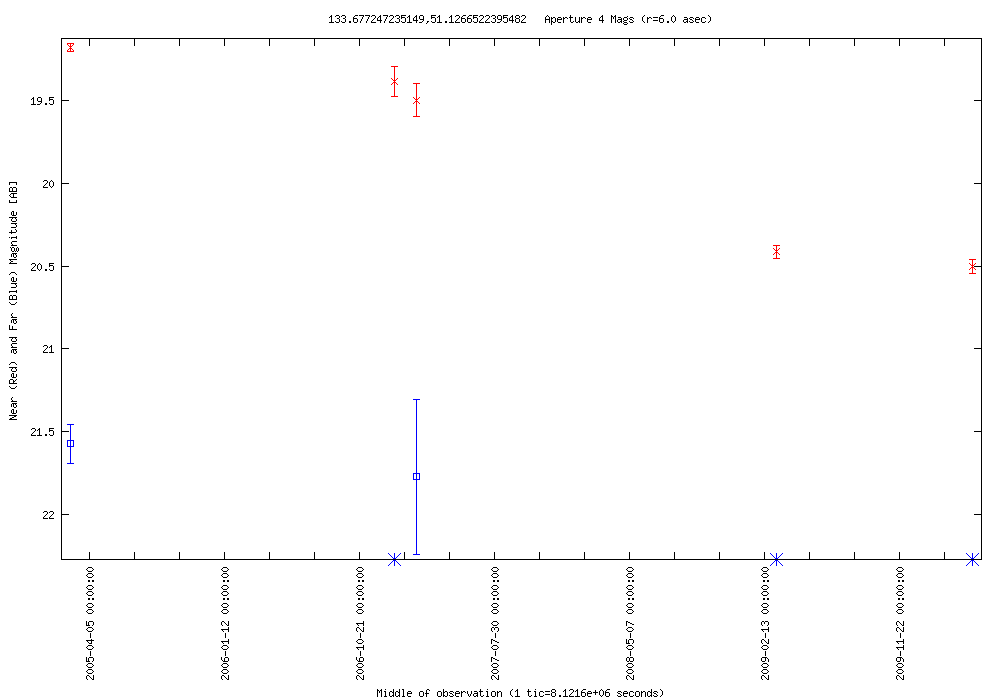
| 2010-04-24 04:18:32-07 | 133.67725 +51.12665 | 1.323 | 19.180 | 3 | 0.000 | 21.574 | 1 | QSO | SDSS J085442.46+510735.8 | z=1.07 | NED Simbad SDSS |  |
LC Plot |
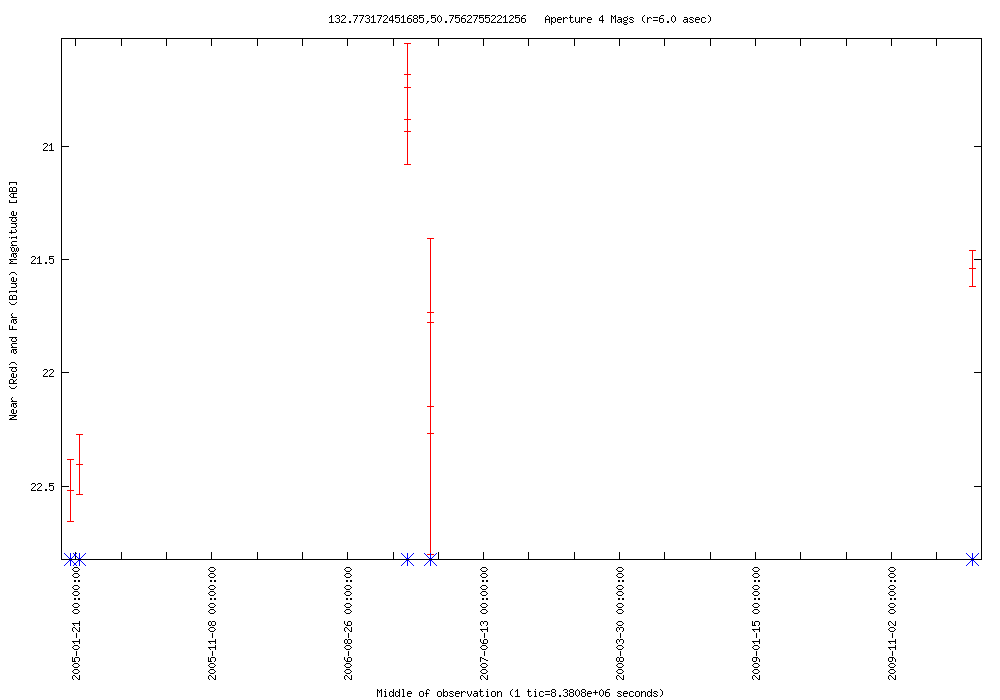
| 2010-04-24 04:18:32-07 | 132.77317 +50.75628 | 0.982 | 21.538 | 3 | 0.000 | 0.000 | 0 | AGN? | SDSS J085105.60+504521.5 | SDSS classified as a star | NED Simbad SDSS |  |
LC Plot |
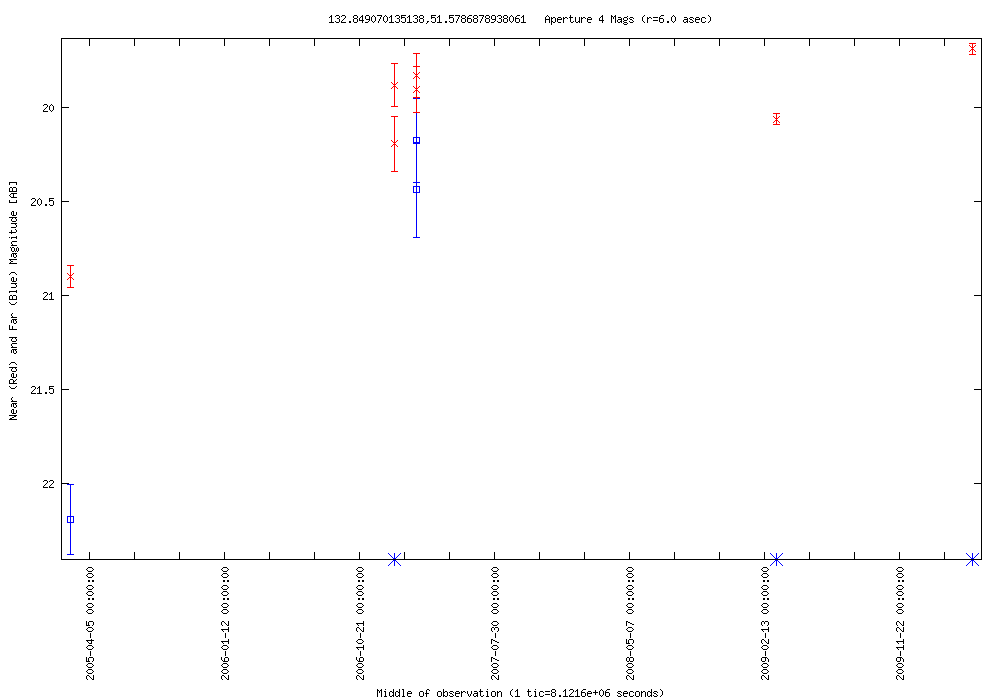
| 2010-04-24 04:18:32-07 | 132.84907 +51.57869 | 1.211 | 19.691 | 3 | 0.000 | 22.195 | 1 | VisS | SDSS J085123.62+513442.8 | SDSS classified as a galaxy | NED Simbad SDSS |  |
LC Plot |
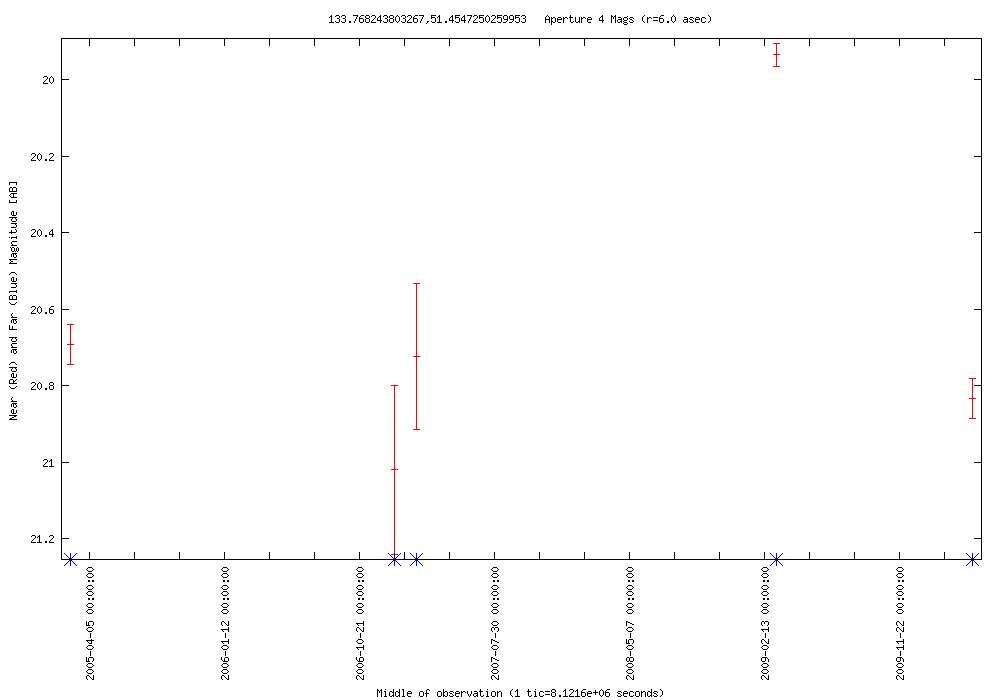
| 2010-04-24 04:18:32-07 | 133.76824 +51.45473 | 0.899 | 19.935 | 3 | 0.000 | 0.000 | 0 | QSO | SDSS J085504.33+512716.6 | z=1.58 | NED Simbad SDSS |  |
LC Plot |
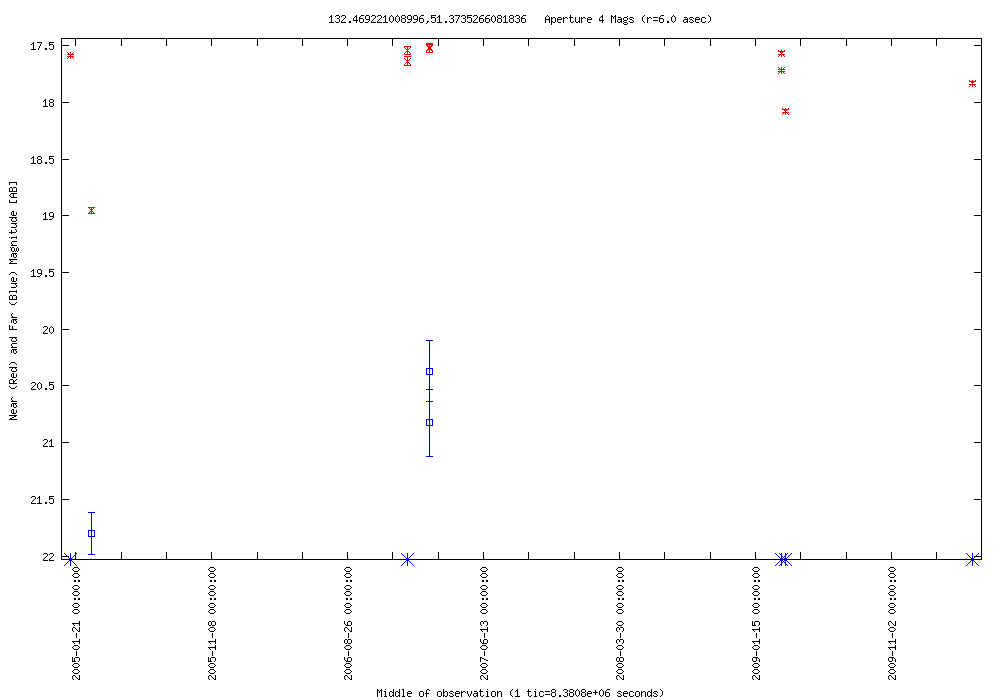
| 2010-04-24 04:18:32-07 | 132.46922 +51.37353 | 1.385 | 17.568 | 6 | 0.000 | 21.800 | 1 | RR Lyrae? | SDSS J084952.59+512224.1 | blue star | NED Simbad SDSS |  |
LC Plot |
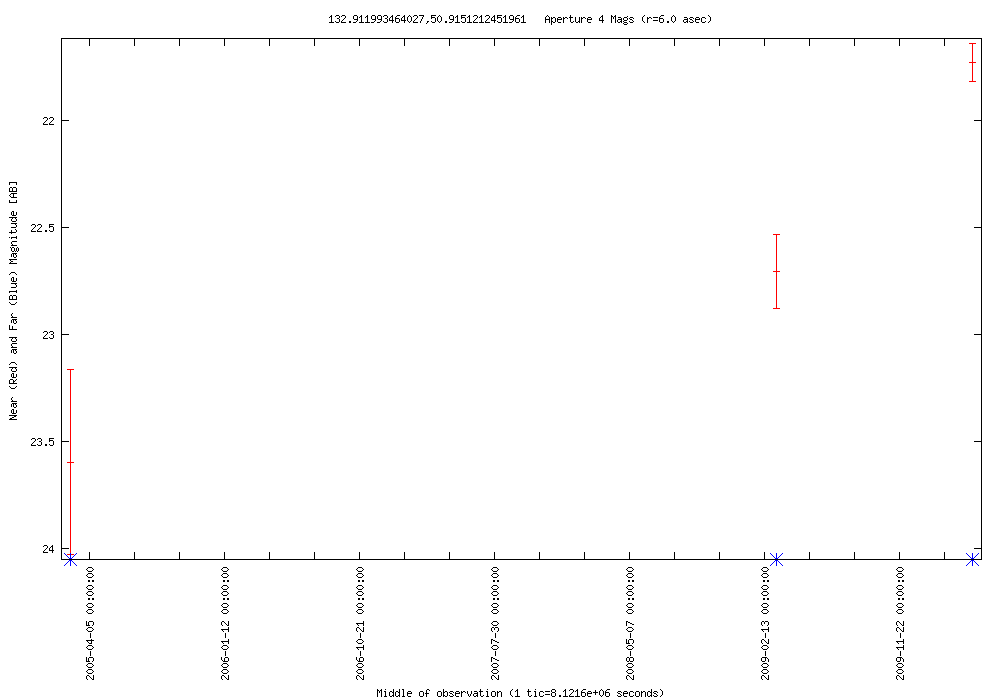
| 2010-04-24 04:18:32-07 | 132.91199 +50.91512 | 1.866 | 21.730 | 3 | 0.000 | 0.000 | 0 | AGN? | SDSS J085138.79+505453.2 | SDSS classified as a star | NED Simbad SDSS |  |
LC Plot |
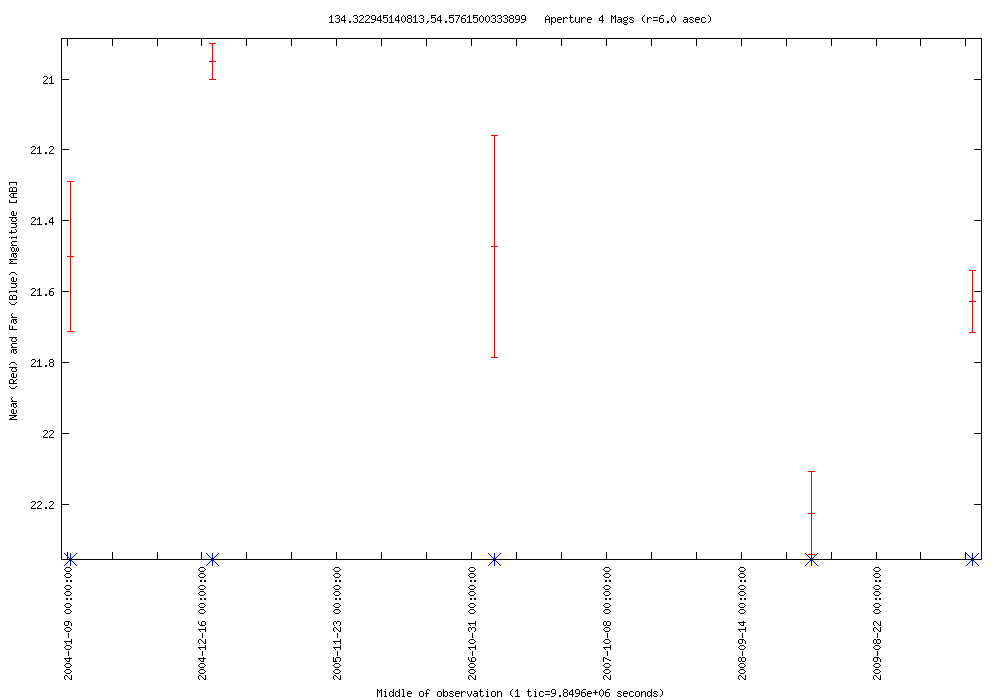
| 2010-04-23 16:48:14-07 | 134.32295 +54.57615 | 1.272 | 20.951 | 3 | 0.000 | 0.000 | 0 | UvES | SDSS J085717.44+543433.8 | SDSS classified as a star | NED Simbad SDSS |  |
LC Plot |
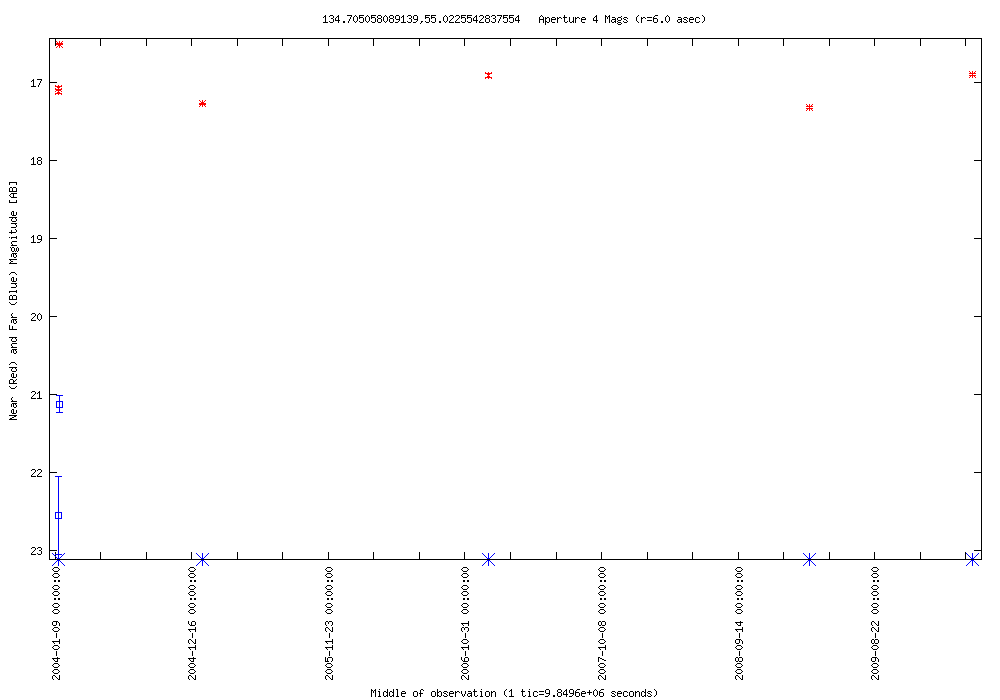
| 2010-04-23 16:48:14-07 | 134.70506 +55.02255 | 0.813 | 16.508 | 4 | 0.000 | 21.128 | 1 | RR Lyrae | NSVS 2508766 | blue star | NED Simbad SDSS |  |
LC Plot |
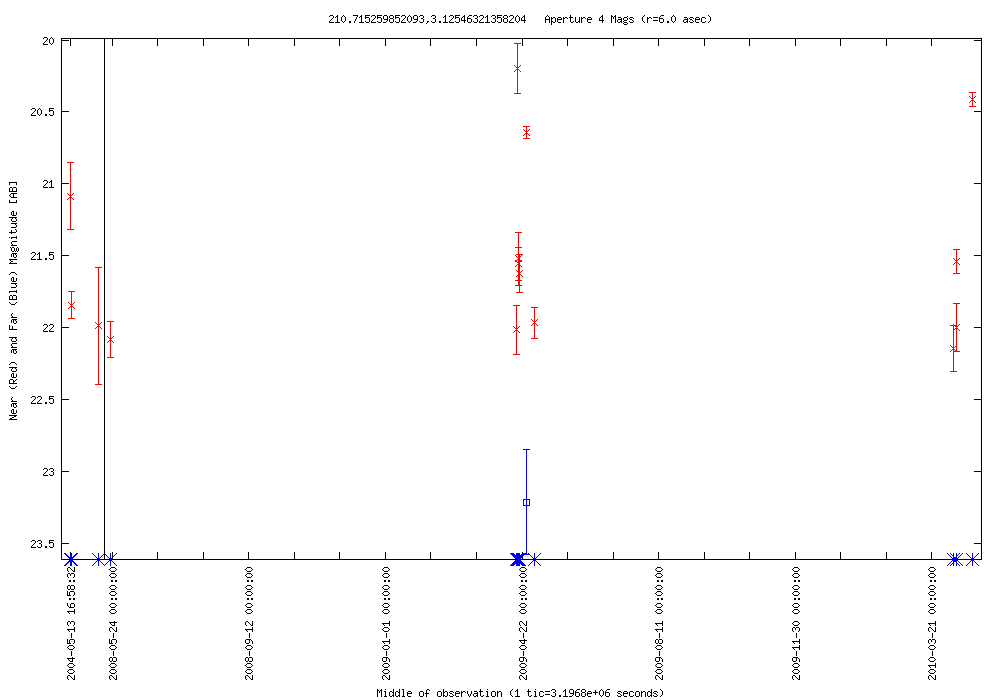
| 2010-04-22 22:43:33-07 | 210.71526 +03.12546 | 1.947 | 20.198 | 13 | 0.000 | 23.212 | 1 | RR Lyrae? | SDSS J140251.64+030732.5 | blue star | NED Simbad SDSS |  |
LC Plot |
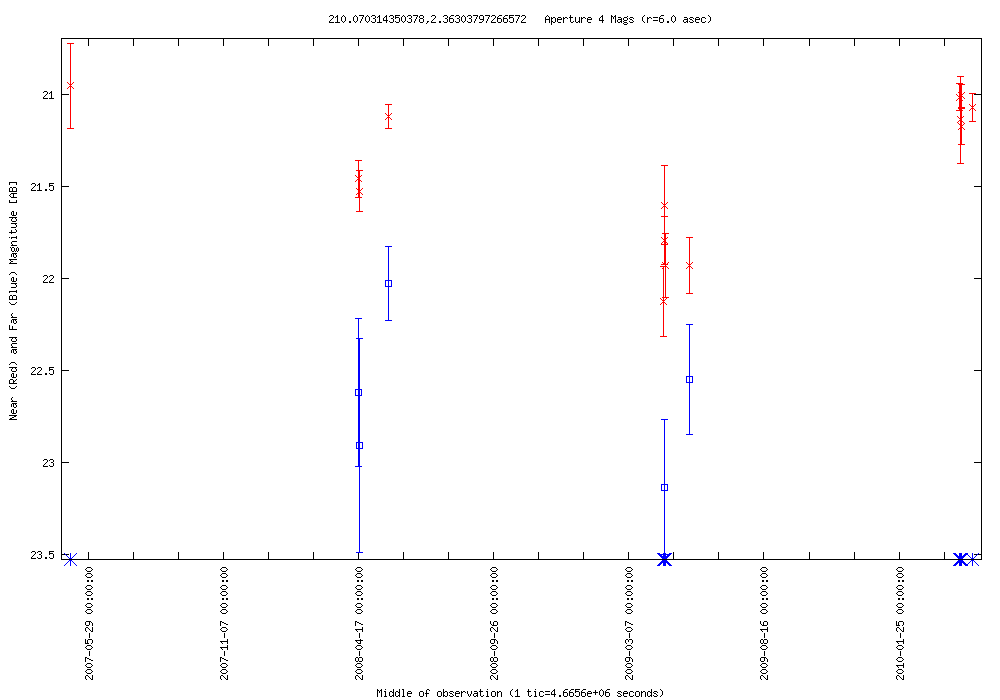
| 2010-04-22 22:43:33-07 | 210.07031 +02.36304 | 1.118 | 21.006 | 13 | 1.121 | 22.027 | 5 | AGN? | SDSS J140016.93+022141.0 | SDSS classified as a galaxy | NED Simbad SDSS |  |
LC Plot |
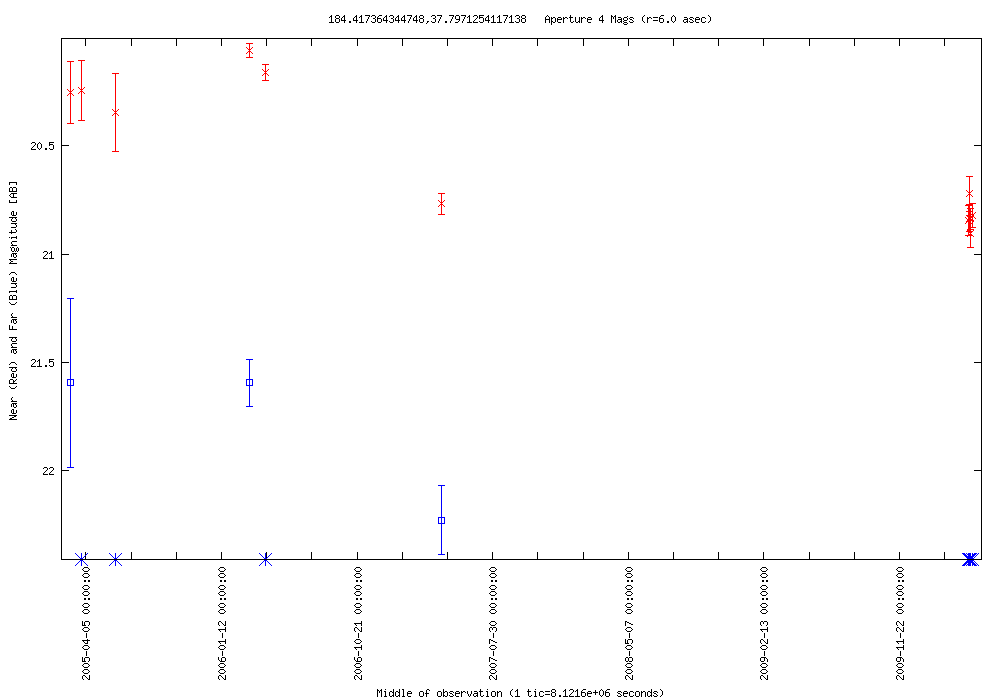
| 2010-04-22 21:04:57-07 | 184.41736 +37.79713 | 0.844 | 20.062 | 9 | 0.632 | 21.595 | 2 | QSO | SDSS J121740.15+374749.2 | z=1.79 | NED Simbad SDSS |  |
LC Plot |
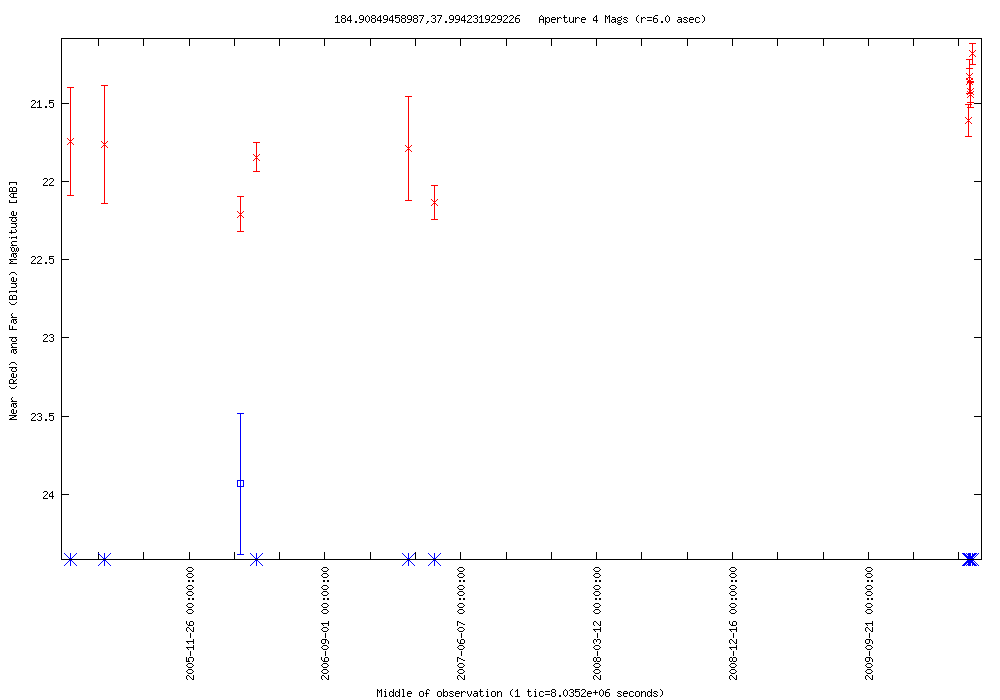
| 2010-04-22 21:04:57-07 | 184.90849 +37.99423 | 1.026 | 21.184 | 9 | 0.000 | 23.932 | 1 | Radio Source | GB6 B1217+3816 | SDSS classified as a galaxy | NED Simbad SDSS |  |
LC Plot |
| 2010-04-22 21:04:57-07 | 184.17364 +37.63740 | 1.466 | 21.625 | 9 | 0.000 | 0.000 | 0 | X | CXOSEXSI J121641.4+373814 | SDSS classified as a star | NED Simbad SDSS | |
LC Plot |
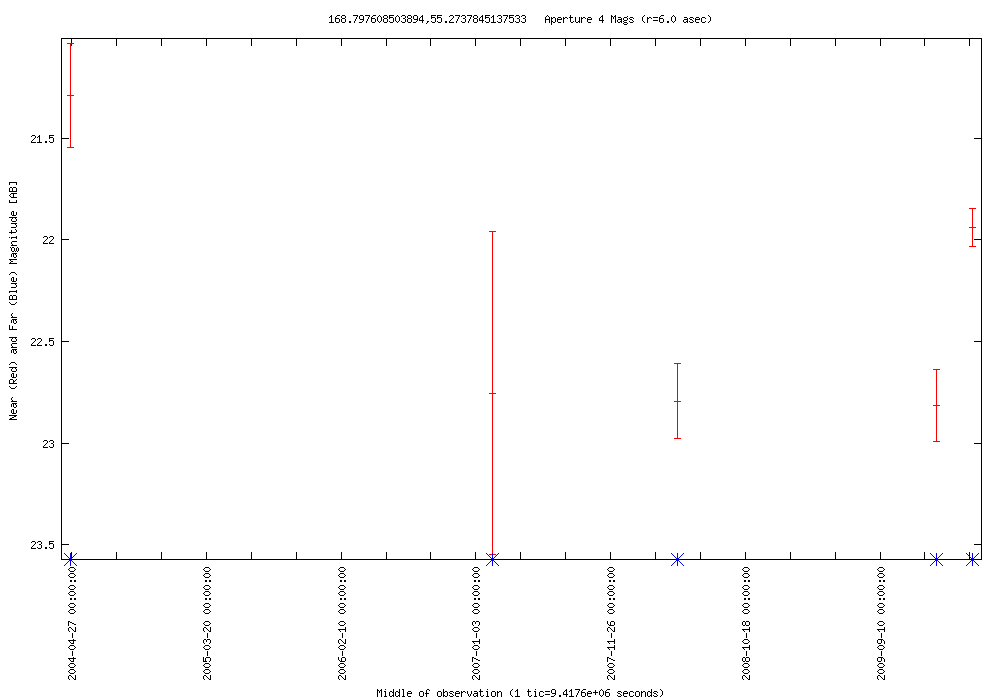
| 2010-04-22 09:34:44-07 | 168.79761 +55.27378 | 0.876 | 21.940 | 3 | 0.000 | 0.000 | 0 | AGN? | SDSS J111511.41+551625.2 | SDSS classified as a star | NED Simbad SDSS |  |
LC Plot |
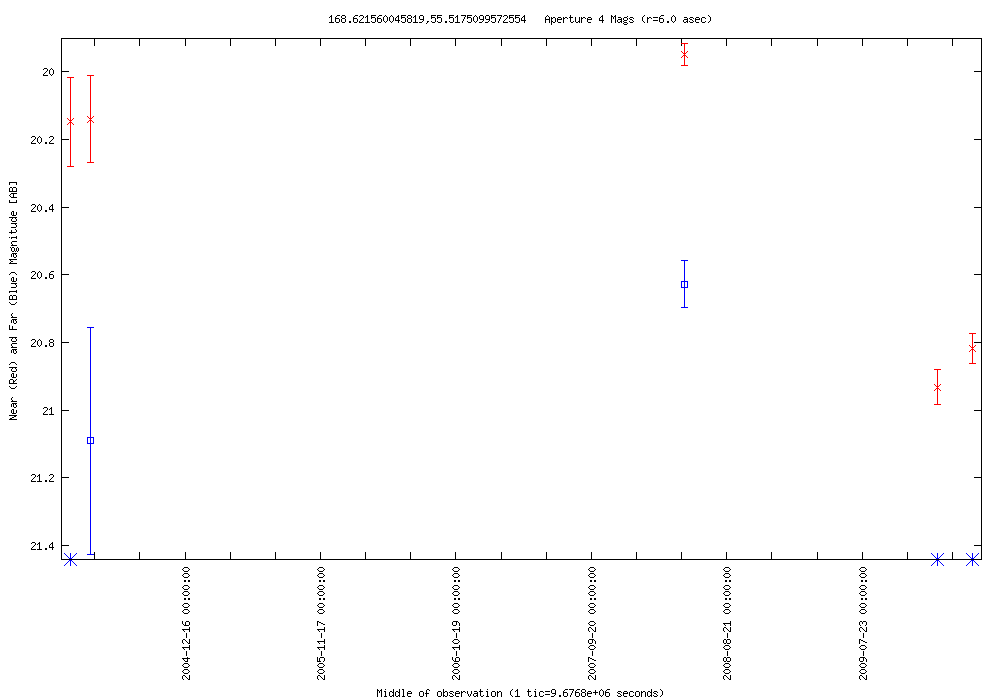
| 2010-04-22 09:34:44-07 | 168.62156 +55.51751 | 0.984 | 19.949 | 3 | 0.000 | 20.629 | 1 | AGN? | SDSS J111429.13+553102.6 | SDSS classified as a star | NED Simbad SDSS |  |
LC Plot |
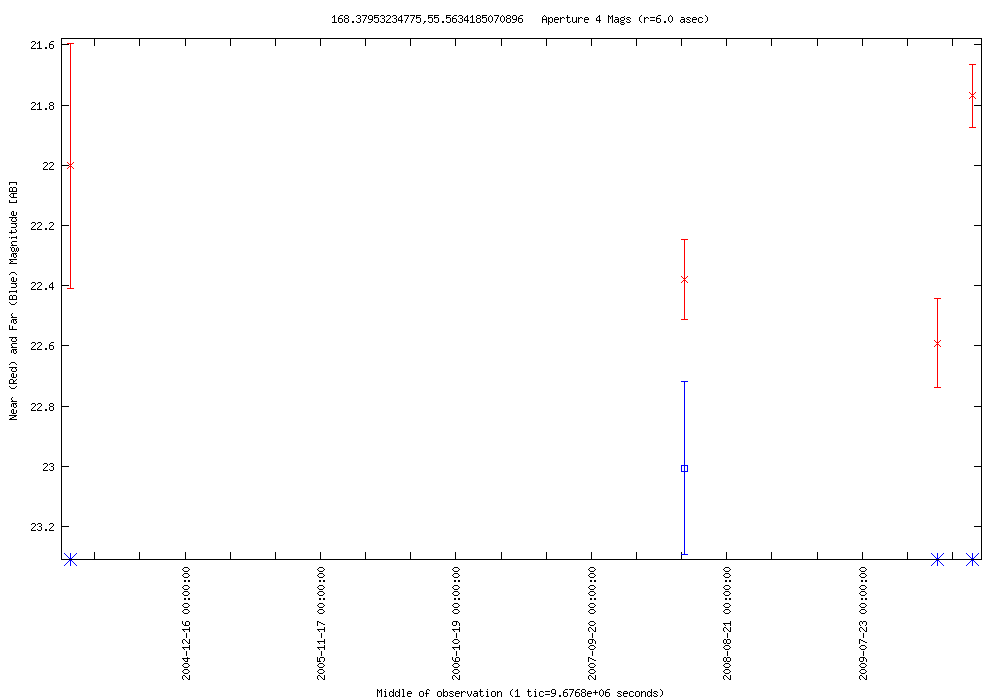
| 2010-04-22 09:34:44-07 | 168.37953 +55.56342 | 0.823 | 21.768 | 3 | 0.000 | 23.006 | 1 | AGN? | SDSS J111331.01+553346.6 | SDSS classified as a star | NED Simbad SDSS |  |
LC Plot |
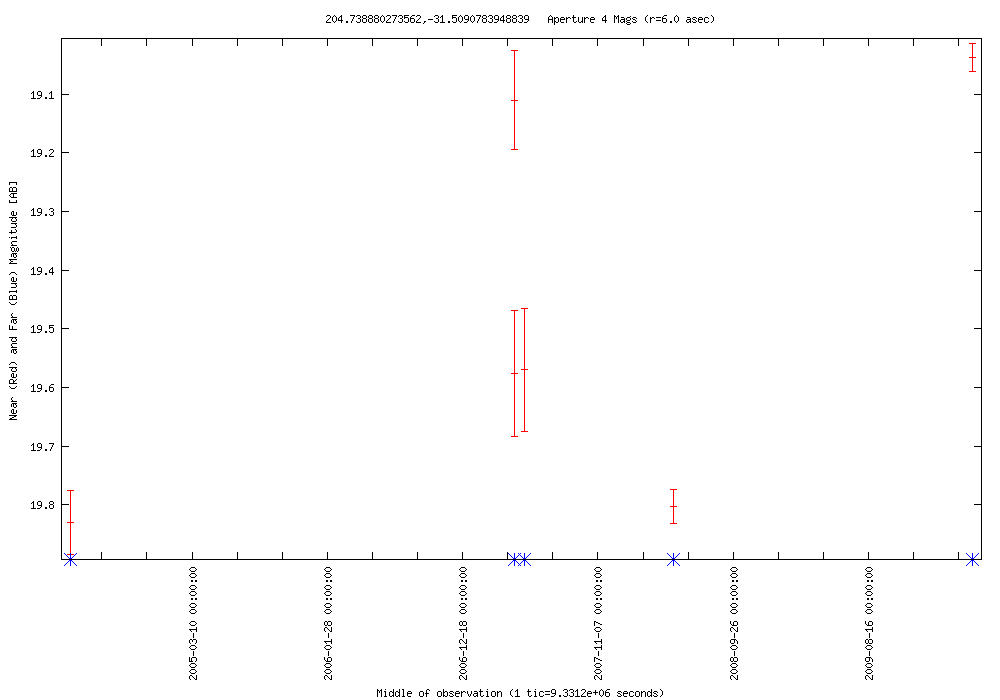
| 2010-04-21 22:04:33-07 | 204.73888 --31.50908 | 0.792 | 19.038 | 3 | 0.000 | 0.000 | 0 | RR Lyrae? | - | blue star | NED Simbad SDSS |  |
LC Plot |
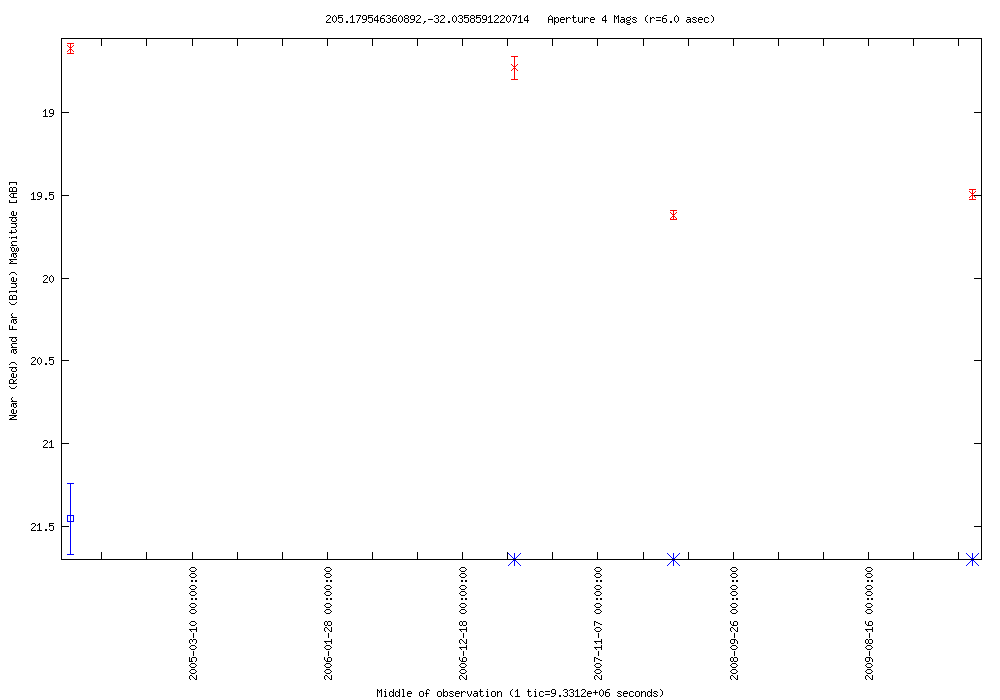
| 2010-04-21 22:04:33-07 | 205.17955 --32.03586 | 1.008 | 18.612 | 3 | 0.000 | 21.455 | 1 | RR Lyrae? | - | blue star | NED Simbad SDSS |  |
LC Plot |
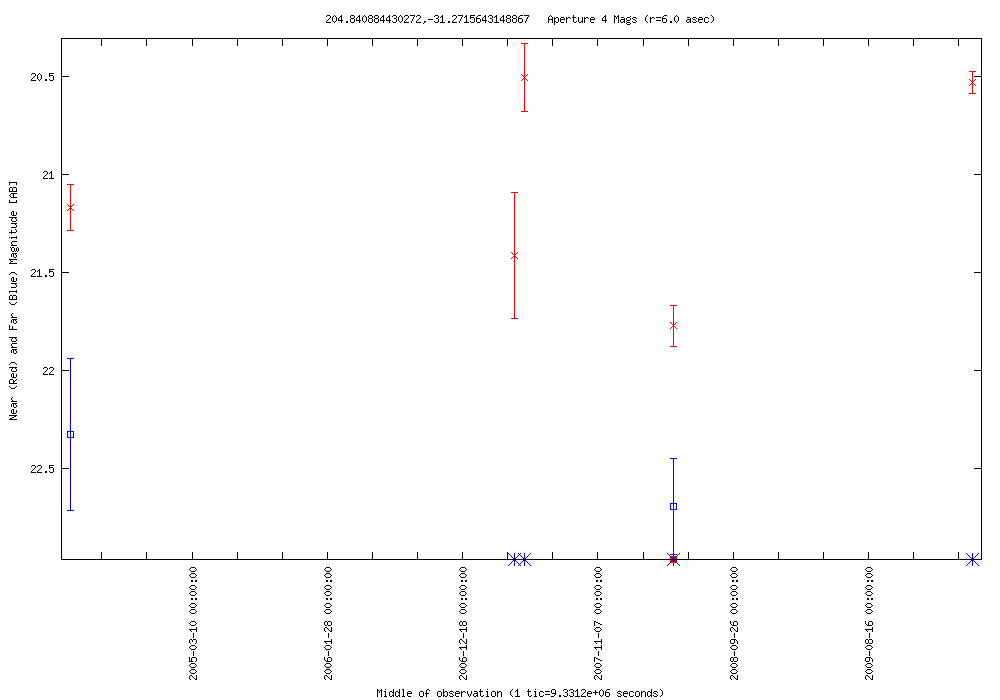
| 2010-04-21 22:04:33-07 | 204.84088 --31.27156 | 1.244 | 20.531 | 3 | 0.367 | 22.330 | 2 | AGN? | - | faint galaxy | NED Simbad SDSS |  |
LC Plot |
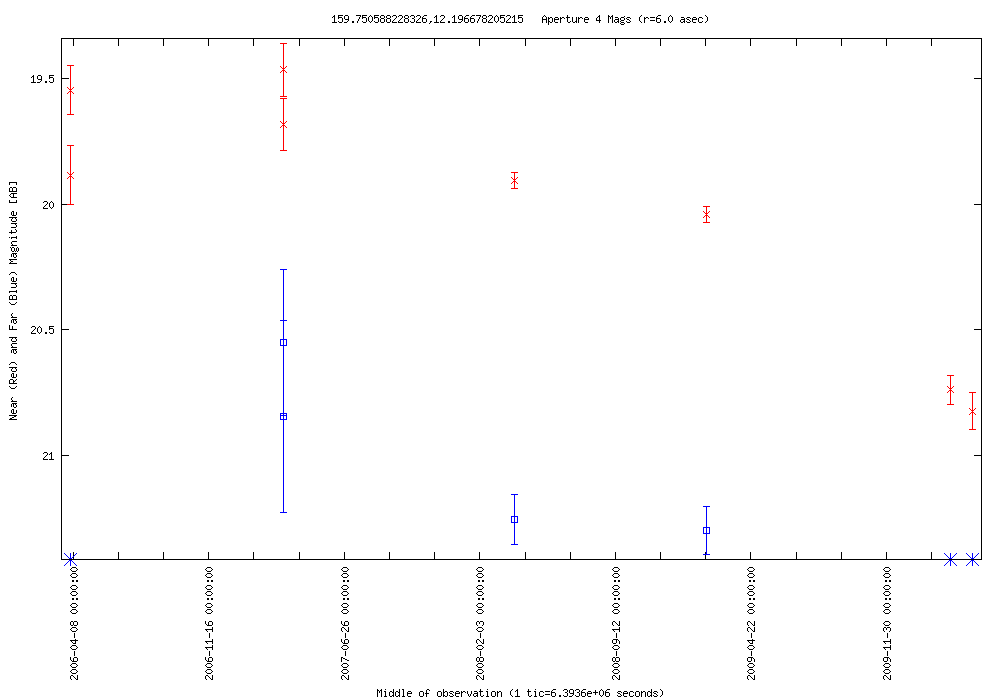
| 2010-04-20 00:04:02-07 | 159.75059 +12.19668 | 0.921 | 19.903 | 4 | 0.044 | 21.253 | 2 | AGN? | SDSS J103900.07+121147.0 | SDSS classified as a star | NED Simbad SDSS |  |
LC Plot |
| 2010-04-19 02:42:28-07 | 186.78949 +15.80412 | 0.896 | 19.064 | 9 | 1.033 | 19.972 | 5 | QSO | LBQS 1224+1604 | z=0.53 | NED Simbad SDSS | |
LC Plot |
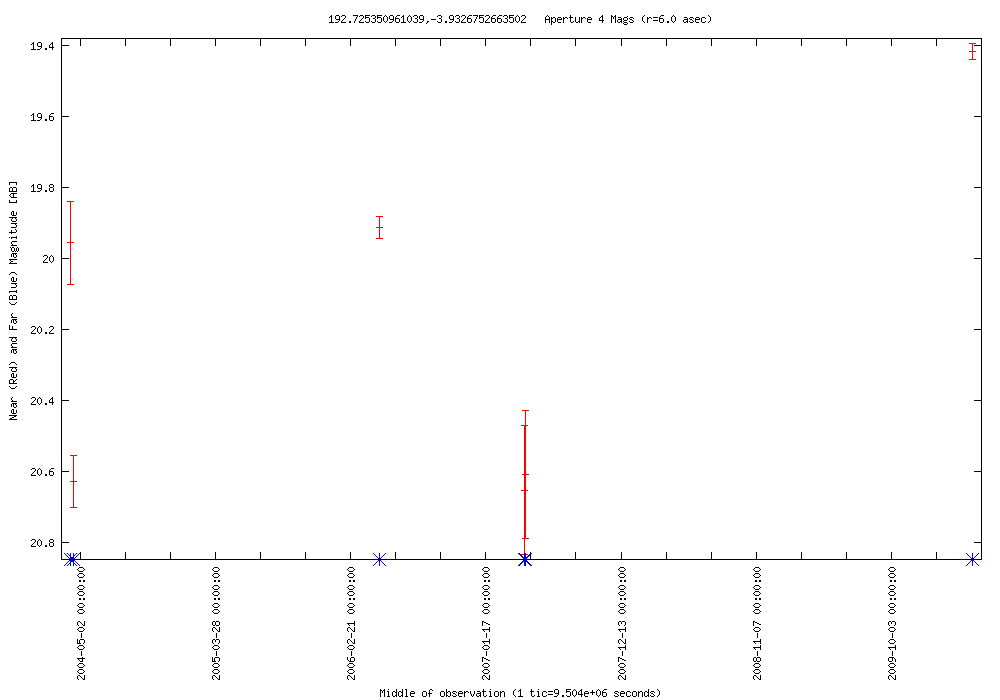
| 2010-04-18 13:33:50-07 | 192.72535 --3.93268 | 1.210 | 19.416 | 3 | 0.000 | 0.000 | 0 | STAR | [CWH2004] CF789-006 | blue star | NED Simbad SDSS |  |
LC Plot |
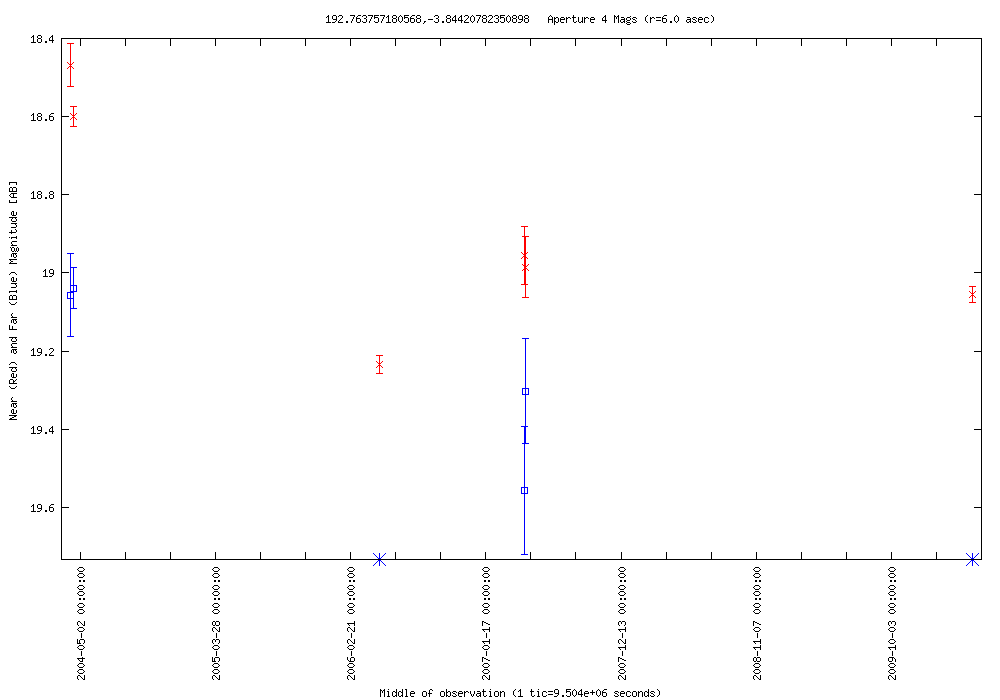
| 2010-04-18 13:33:50-07 | 192.76376 --3.84421 | 0.634 | 18.600 | 3 | 0.000 | 19.039 | 1 | AGN? | - | blue star | NED Simbad SDSS |  |
LC Plot |
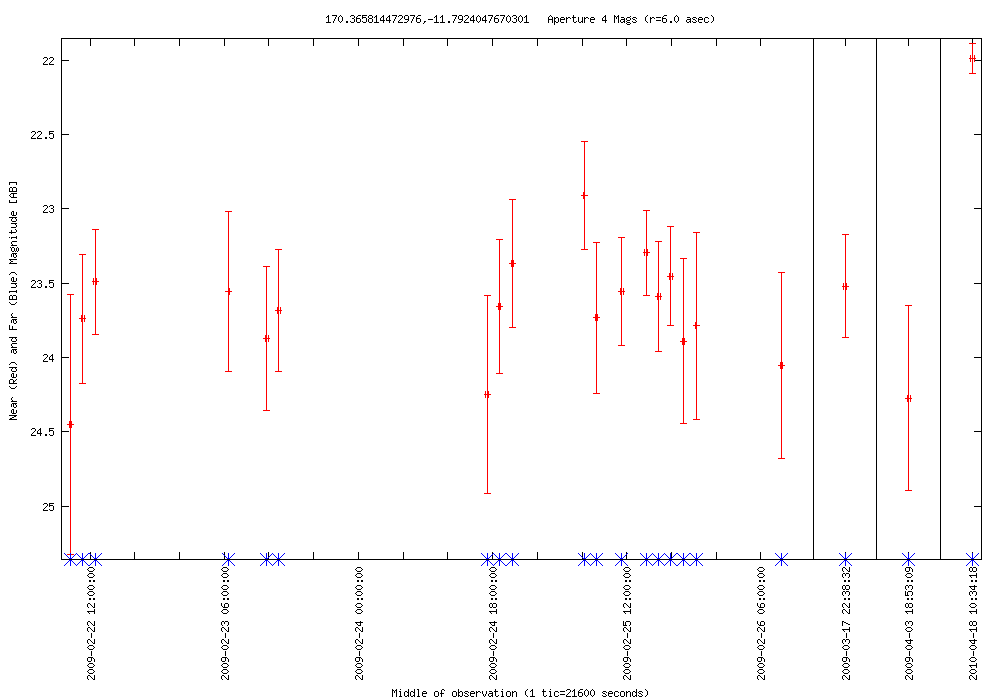
| 2010-04-18 10:16:41-07 | 170.36581 --11.79240 | 2.461 | 21.990 | 21 | 0.000 | 0.000 | 0 | AGN? | SDSS J112127.73-114733.9 | SDSS classified as a star | NED Simbad SDSS |  |
LC Plot |
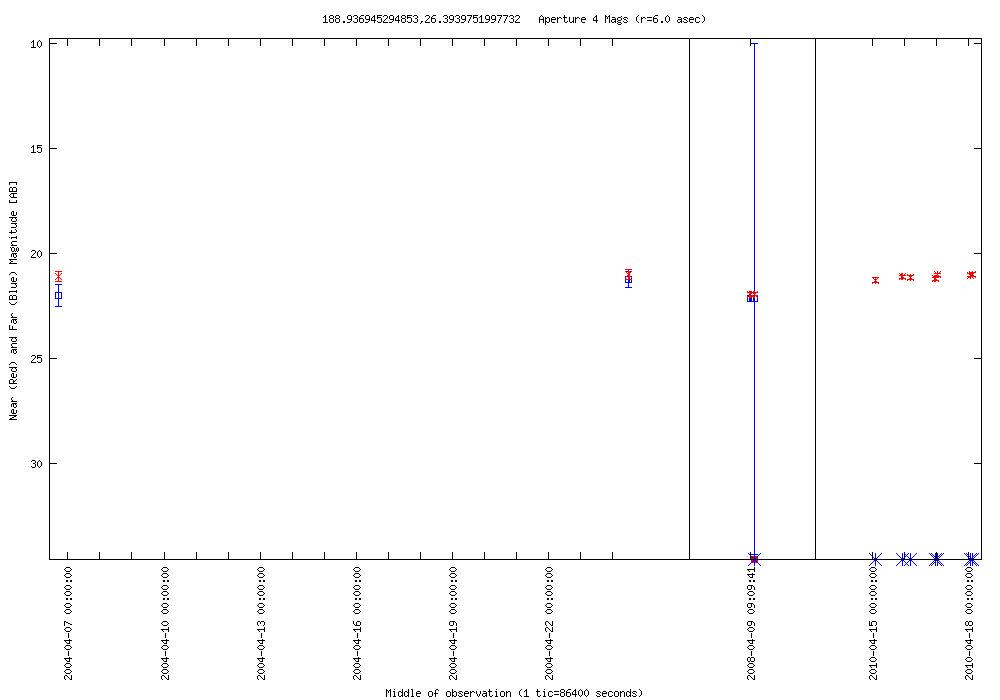
| 2010-04-18 00:25:13-07 | 188.93695 +26.39398 | 0.973 | 20.988 | 9 | 0.000 | 22.155 | 1 | AGN? | SDSS J123544.79+262338.6 | QSO candidate | NED Simbad SDSS |  |
LC Plot |
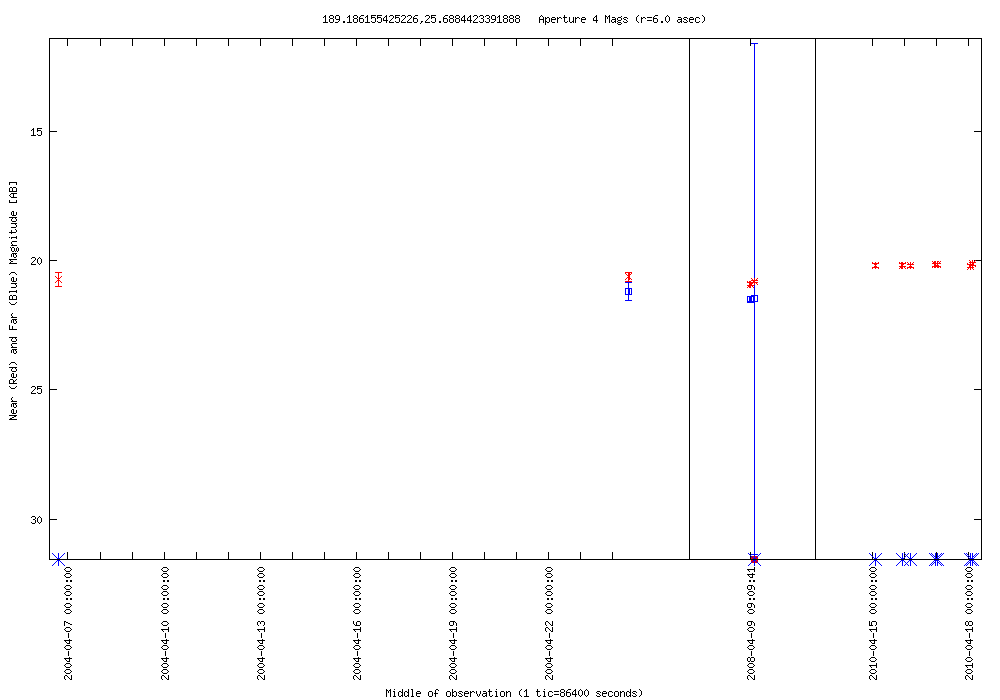
| 2010-04-18 00:25:13-07 | 189.18616 +25.68844 | 0.787 | 20.120 | 9 | 0.006 | 21.484 | 2 | AGN? | SDSS J123644.67+254118.5 | SDSS classified as a galaxy | NED Simbad SDSS |  |
LC Plot |
| 2010-04-18 00:25:13-07 | 189.30075 +26.18950 | 1.022 | 20.559 | 11 | 0.000 | 21.332 | 1 | AGN? | SDSS J123712.11+261122.3 | SDSS classified as a star | NED Simbad SDSS | |
LC Plot |
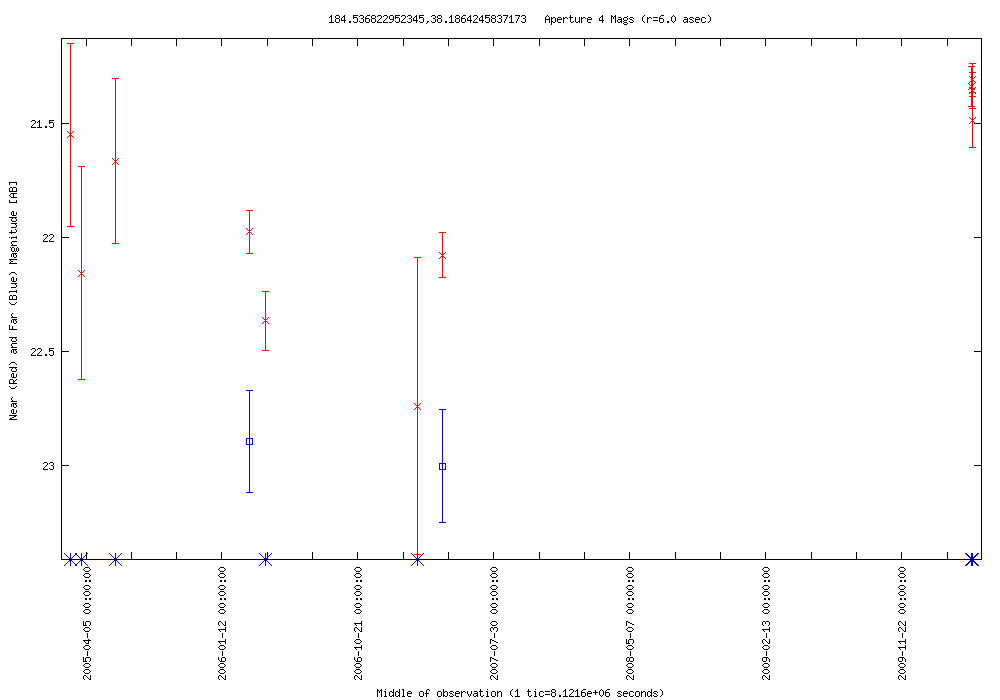
| 2010-04-17 19:29:30-07 | 184.53682 +38.18642 | 1.055 | 21.310 | 7 | 0.108 | 22.894 | 2 | AGN? | SDSS J121808.78+381110.6 | SDSS classified as a star | NED Simbad SDSS |  |
LC Plot |
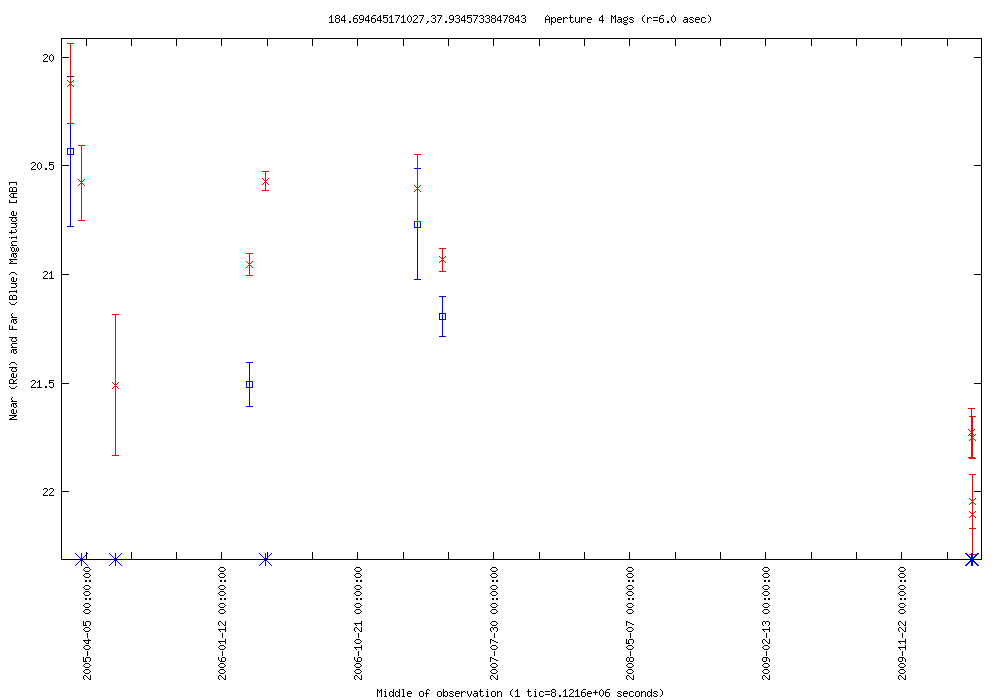
| 2010-04-17 19:29:30-07 | 184.69465 +37.93457 | 1.534 | 20.570 | 7 | 0.312 | 21.193 | 2 | AGN? | SDSS J121846.64+375604.5 | SDSS classified as a galaxy | NED Simbad SDSS |  |
LC Plot |
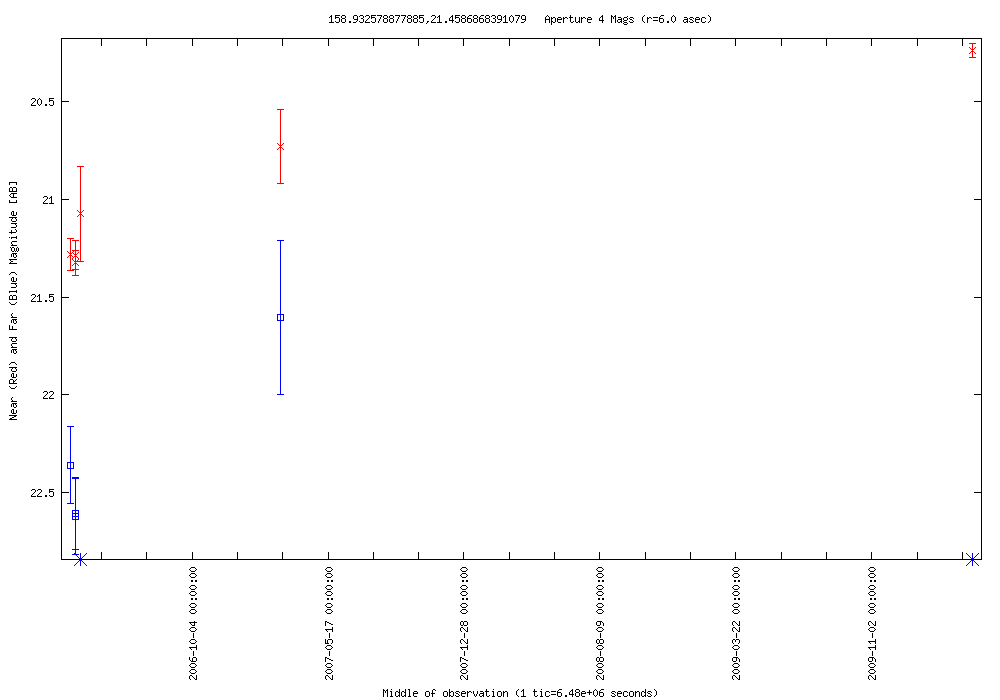
| 2010-04-17 14:33:46-07 | 158.93258 +21.45869 | 1.085 | 20.239 | 4 | 0.262 | 22.359 | 3 | AGN? | SDSS J103543.74+212730.6 | SDSS classified as a star | NED Simbad SDSS |  |
LC Plot |
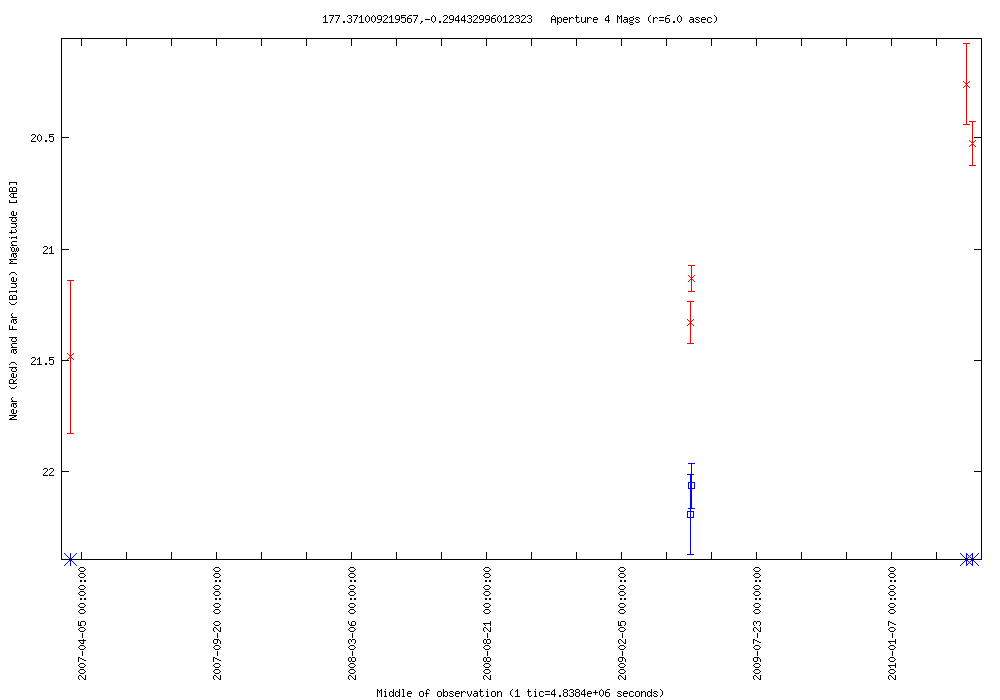
| 2010-04-17 03:03:45-07 | 177.37101 --0.29443 | 1.071 | 20.258 | 4 | 0.128 | 22.064 | 2 | VisS | SDSS J114929.02-001739.4 | SDSS classified as a galaxy | NED Simbad SDSS |  |
LC Plot |
| 2010-04-16 22:08:02-07 | 189.04764 +26.20366 | 1.463 | 20.904 | 7 | 0.000 | 0.000 | 0 | X | RX J1235.1+2612 | aka? SDSS J123611.45+261210.8 | NED Simbad SDSS |  |
LC Plot |
| 2010-04-16 22:08:02-07 | 189.07010 +25.48030 | 1.241 | 21.433 | 7 | 0.000 | 0.000 | 0 | AGN? | SDSS J123616.81+252849.3 | SDSS classified as a star | NED Simbad SDSS | |
LC Plot |
| 2010-04-16 20:29:28-07 | 184.14544 +37.39136 | 1.076 | 19.923 | 6 | 0.177 | 21.857 | 2 | Radio Source, AGN? | GB6 B1214+3740 | SDSS classified as a star | NED Simbad SDSS |  |
LC Plot |
| 2010-04-16 04:03:45-07 | 188.87728 +25.65806 | 1.611 | 20.659 | 7 | 0.000 | 23.707 | 1 | RR Lyrae? | SDSS J123530.51+253928.7 | blue star | NED Simbad SDSS | |
LC Plot |
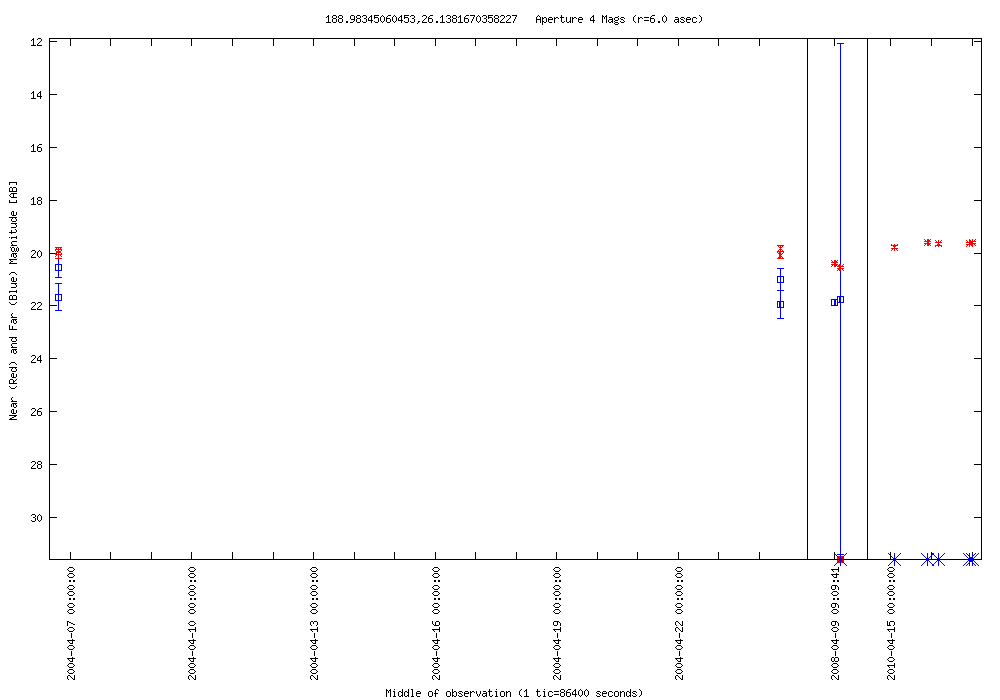
| 2010-04-15 21:29:28-07 | 188.98345 +26.13817 | 0.928 | 19.601 | 7 | 0.125 | 21.735 | 2 | VisS | SDSS J123556.00+260817.2 | QSO candidate | NED Simbad SDSS |  |
LC Plot |
| 2010-04-15 21:29:28-07 | 189.42299 +26.27094 | 0.837 | 18.474 | 9 | 2.249 | 20.747 | 4 | RR Lyrae? | SDSS J123741.44+261615.2 | blue star | NED Simbad SDSS | |
LC Plot |
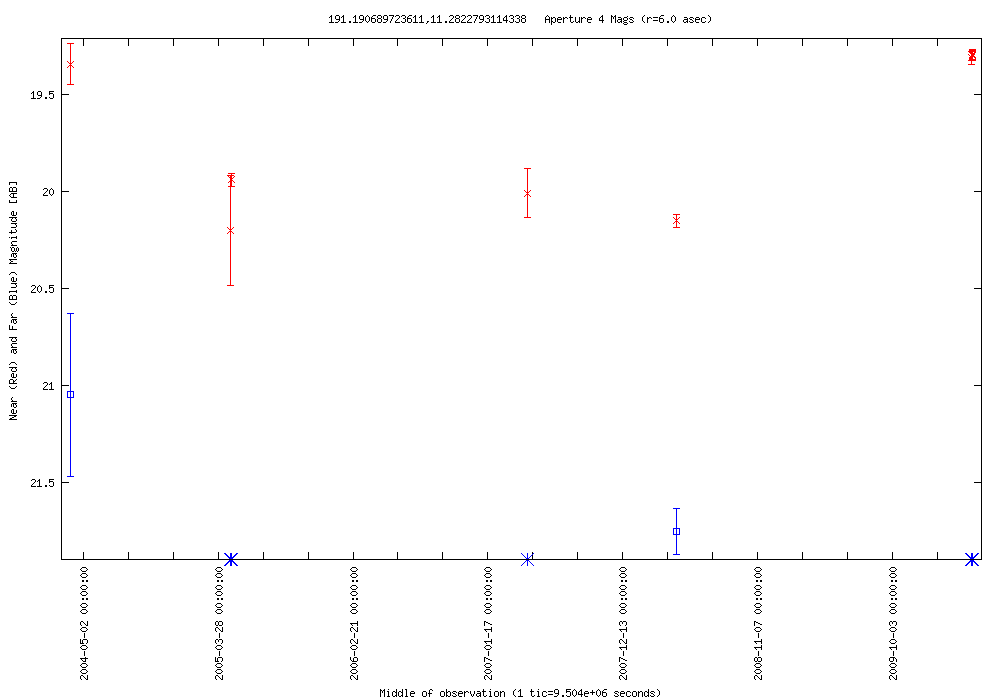
| 2010-04-15 18:12:19-07 | 191.19069 +11.28228 | 0.859 | 19.292 | 5 | 0.000 | 21.752 | 1 | QSO | SDSS J124445.70+111656.0 | z=0.98 | NED Simbad SDSS |  |
LC Plot |
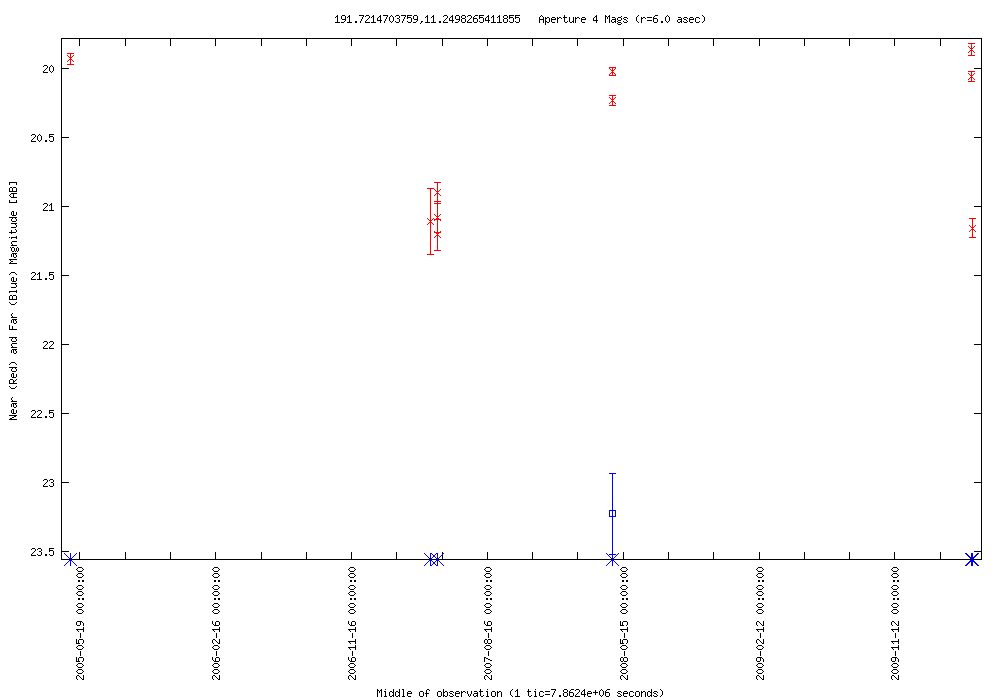
| 2010-04-15 18:12:19-07 | 191.72147 +11.24983 | 1.342 | 19.861 | 9 | 0.000 | 23.226 | 1 | RR Lyrae? | SDSS J124653.14+111459.0 | blue star | NED Simbad SDSS |  |
LC Plot |
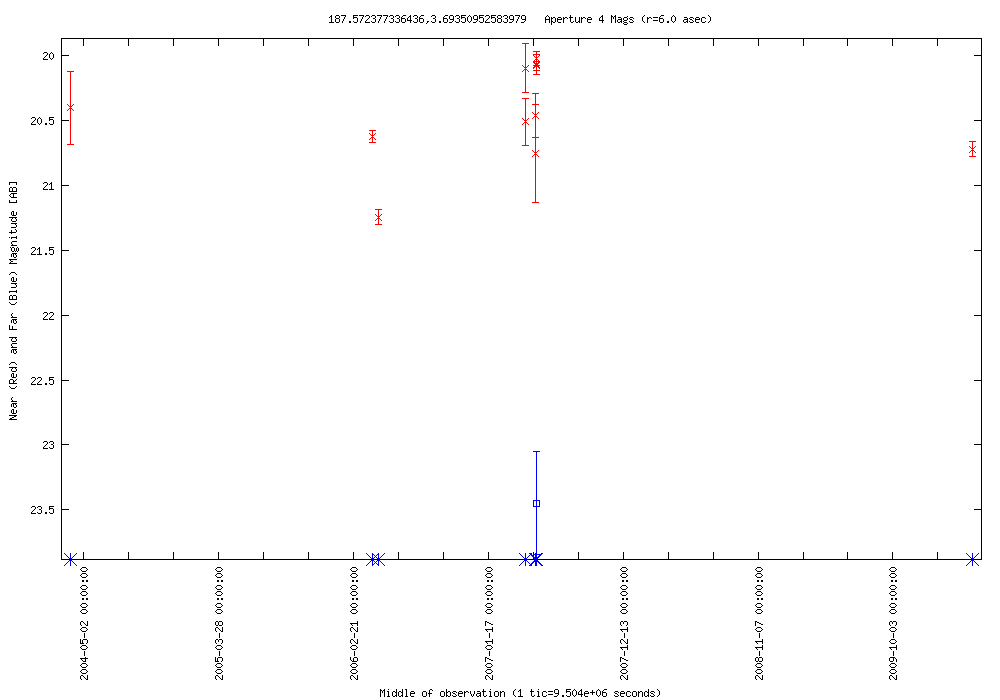
| 2010-04-15 11:38:02-07 | 187.57238 +03.69351 | 1.224 | 20.019 | 5 | 0.000 | 23.449 | 1 | RR Lyrae? | SDSS J123017.31+034136.0 | blue star | NED Simbad SDSS |  |
LC Plot |
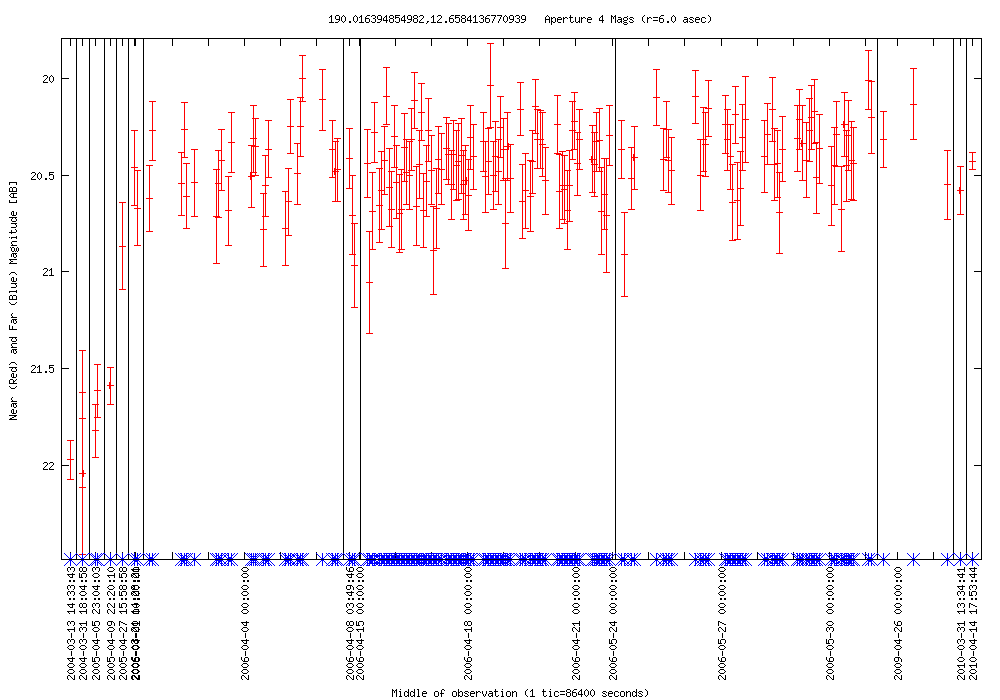
| 2010-04-14 17:33:46-07 | 190.01639 +12.65841 | 1.544 | 20.427 | 6 | 0.000 | 0.000 | 0 | AGN? | SDSS J124003.86+123930.1 | SDSS classified as a star | NED Simbad SDSS |  |
LC Plot |
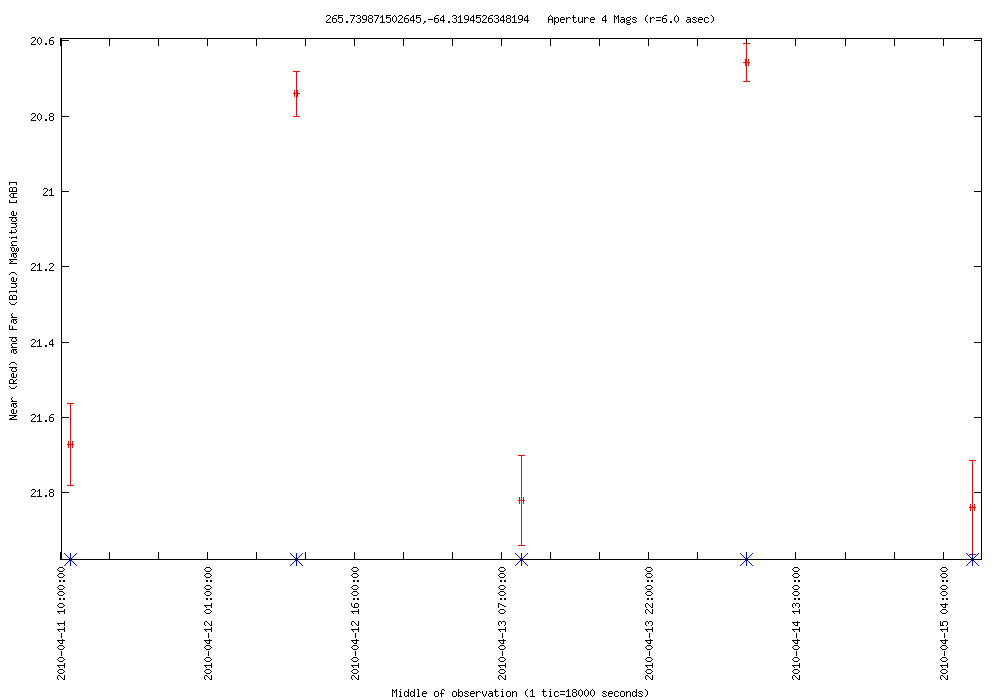
| 2010-04-14 07:42:20-07 | 265.73987 --64.31945 | 1.182 | 20.657 | 5 | 0.000 | 0.000 | 0 | RR Lyrae? | - | blue star | NED Simbad SDSS |  |
LC Plot |
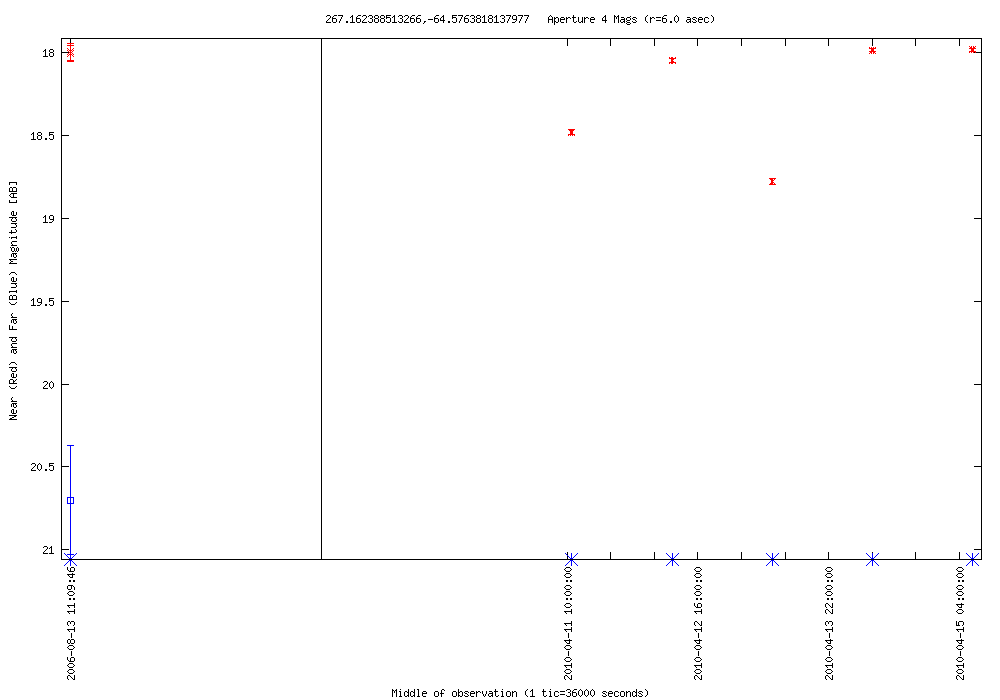
| 2010-04-14 07:42:20-07 | 267.16239 --64.57638 | 0.795 | 17.981 | 5 | 0.000 | 0.000 | 0 | RR Lyrae? | - | blue star | NED Simbad SDSS |  |
LC Plot |
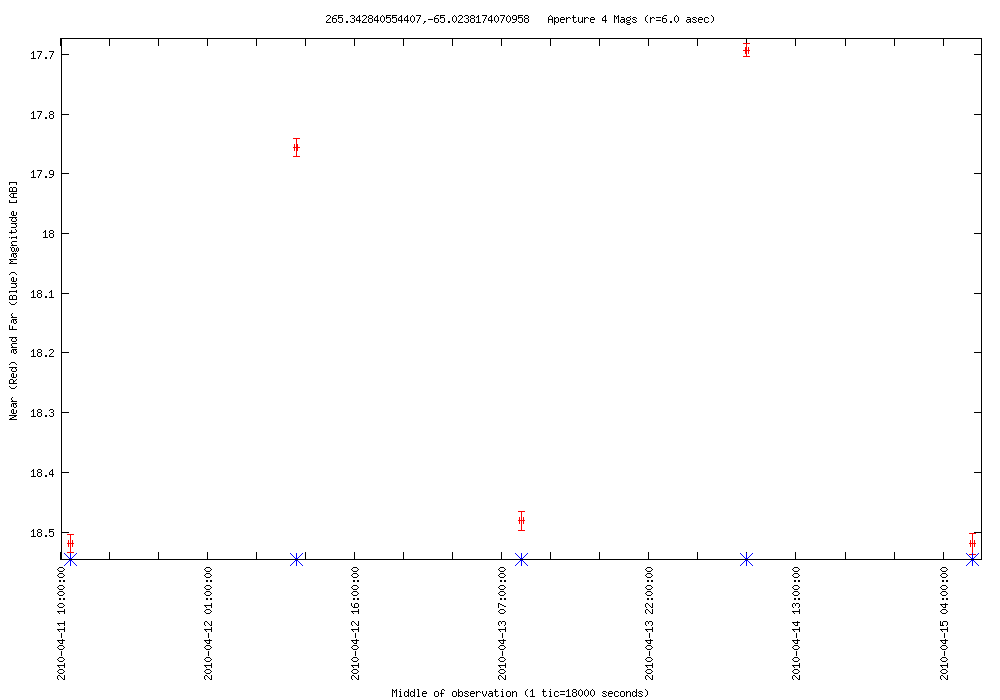
| 2010-04-14 07:42:20-07 | 265.34284 --65.02382 | 0.827 | 17.692 | 5 | 0.000 | 0.000 | 0 | RR Lyrae? | - | star | NED Simbad SDSS |  |
LC Plot |
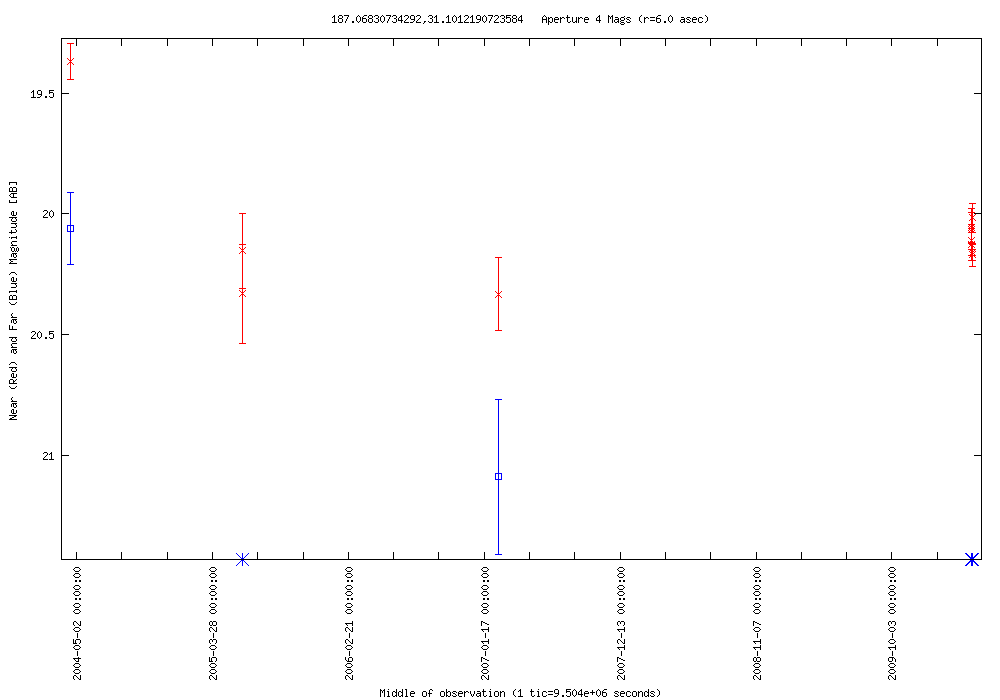
| 2010-04-14 01:08:04-07 | 187.06831 +31.10122 | 0.801 | 19.368 | 8 | 0.000 | 20.061 | 1 | VisS | SDSS J122816.49+310605.2 | QSO candidate | NED Simbad SDSS |  |
LC Plot |
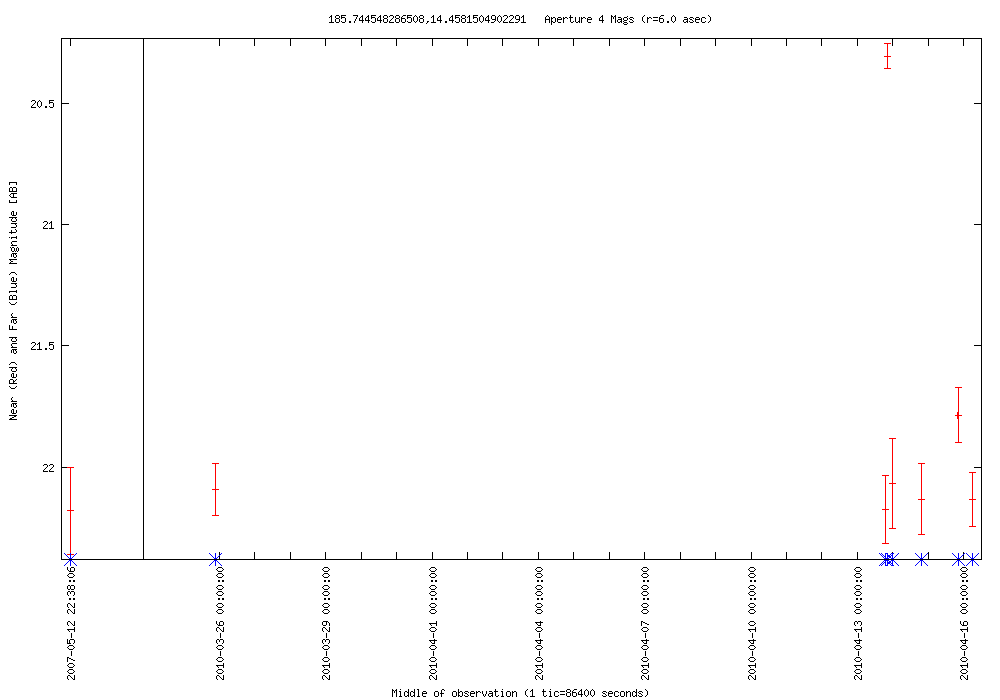
| 2010-04-13 20:12:21-07 | 185.74455 +14.45815 | 1.872 | 20.307 | 7 | 0.000 | 0.000 | 0 | Flare star? | SDSS J122258.68+142727.5 | red star | NED Simbad SDSS |  |
LC Plot |
| 2010-04-13 18:33:47-07 | 185.26825 +14.76110 | 2.384 | 21.559 | 48 | 0.597 | 23.288 | 3 | AGN? | SDSS J122104.30+144539.6 | SDSS classified as a star | NED Simbad SDSS | |
LC Plot |
| 2010-04-12 22:50:56-07 | 188.58976 +16.12896 | 1.298 | 16.045 | 3 | 0.000 | 20.697 | 1 | RR Lyrae | DL Com | SDSS classified as a star | NED Simbad SDSS |  |
LC Plot |
| 2010-04-12 19:33:47-07 | 187.01968 +15.42075 | 1.579 | 19.980 | 8 | 1.986 | 20.983 | 4 | AGN? | SDSS J122804.62+152513.2 | SDSS classified as a star | NED Simbad SDSS | |
LC Plot |
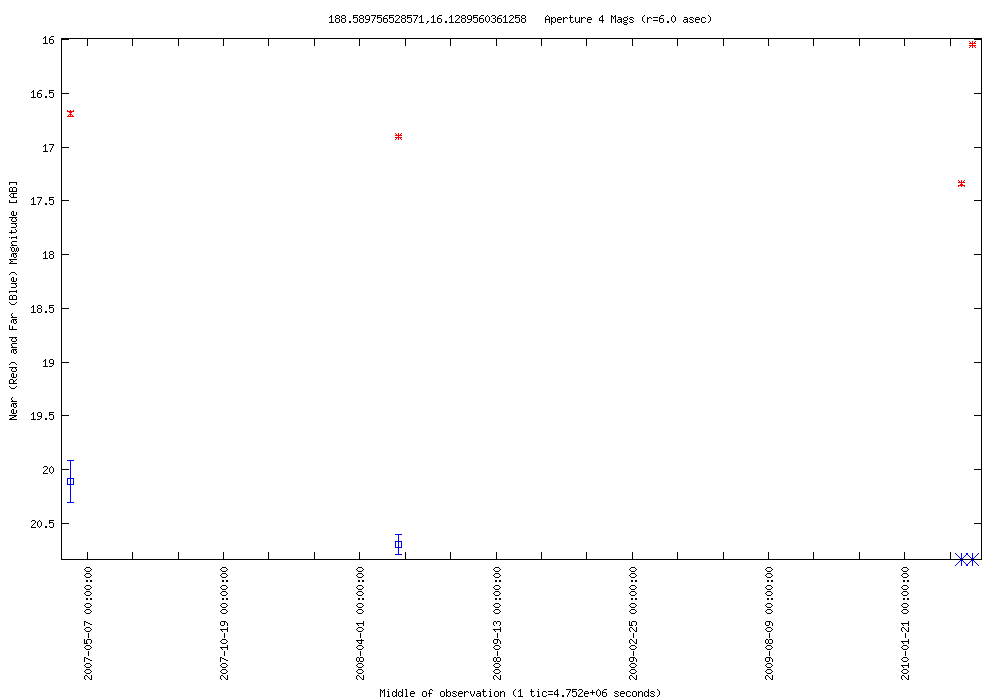
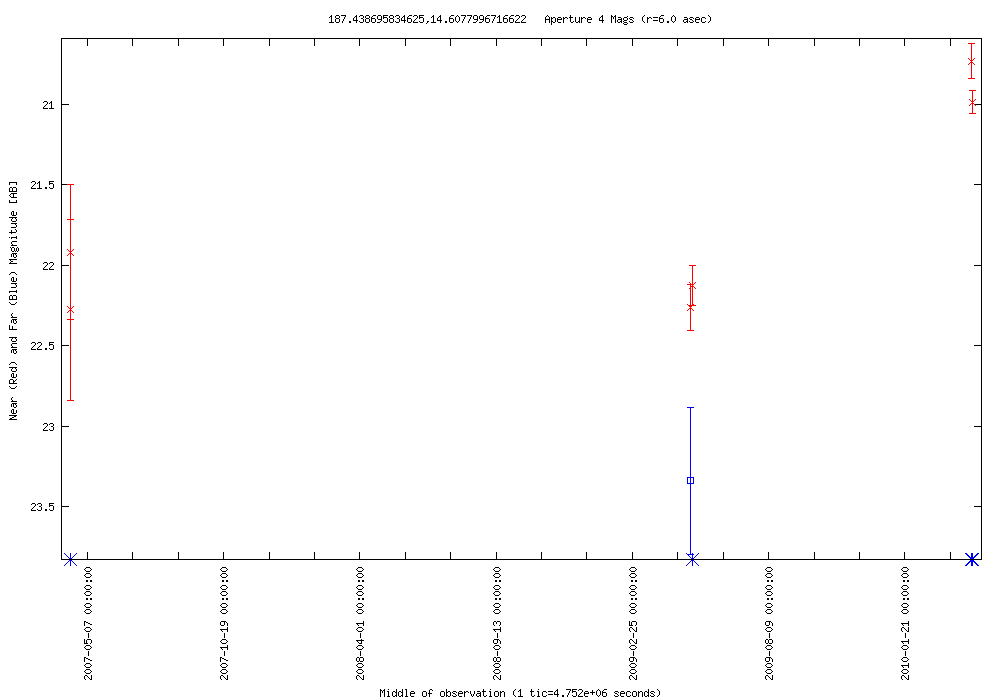
| 2010-04-12 19:33:47-07 | 187.43870 +14.60780 | 1.533 | 20.730 | 4 | 0.000 | 23.338 | 1 | AGN? | SDSS J122945.35+143628.6 | SDSS classified as a star | NED Simbad SDSS |  |
LC Plot |
| 2010-04-12 19:33:47-07 | 187.23296 +15.39385 | 2.302 | 21.253 | 4 | 0.000 | 23.911 | 1 | AGN? | SDSS J122856.01+152338.6 | SDSS classified as a galaxy | NED Simbad SDSS | |
LC Plot |
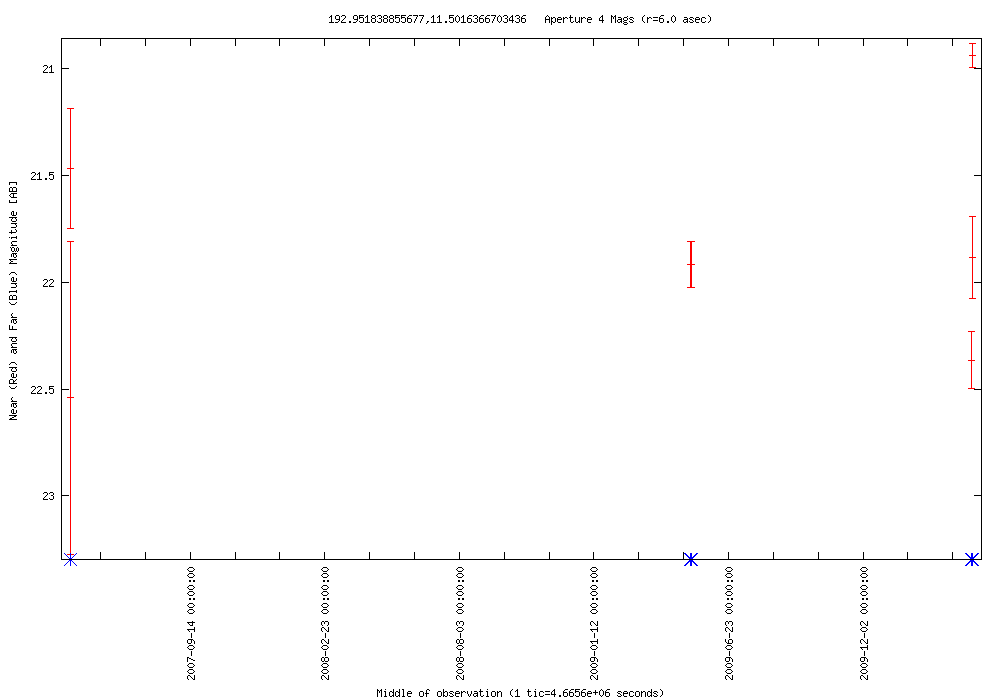
| 2010-04-12 17:55:13-07 | 192.95184 +11.50164 | 1.426 | 20.939 | 5 | 0.000 | 0.000 | 0 | RR Lyrae? | SDSS J125148.41+113006.1 | blue star | NED Simbad SDSS |  |
LC Plot |
| 2010-04-12 04:46:38-07 | 192.88868 +10.94243 | 1.046 | 18.110 | 6 | 0.000 | 0.000 | 0 | RR Lyrae? | SDSS J125133.23+105633.1 | blue star | NED Simbad SDSS | |
LC Plot |
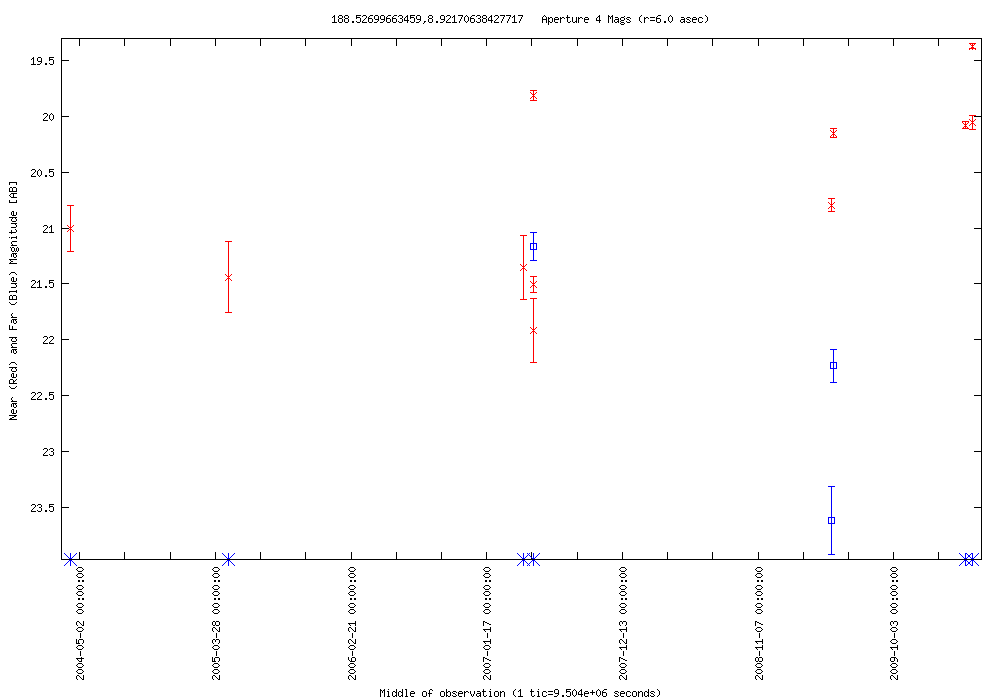
| 2010-04-11 23:50:55-07 | 188.52700 +08.92171 | 2.549 | 19.371 | 8 | 2.454 | 21.166 | 3 | RR Lyrae? | SDSS J123406.44+085517.9 | blue star | NED Simbad SDSS |  |
LC Plot |
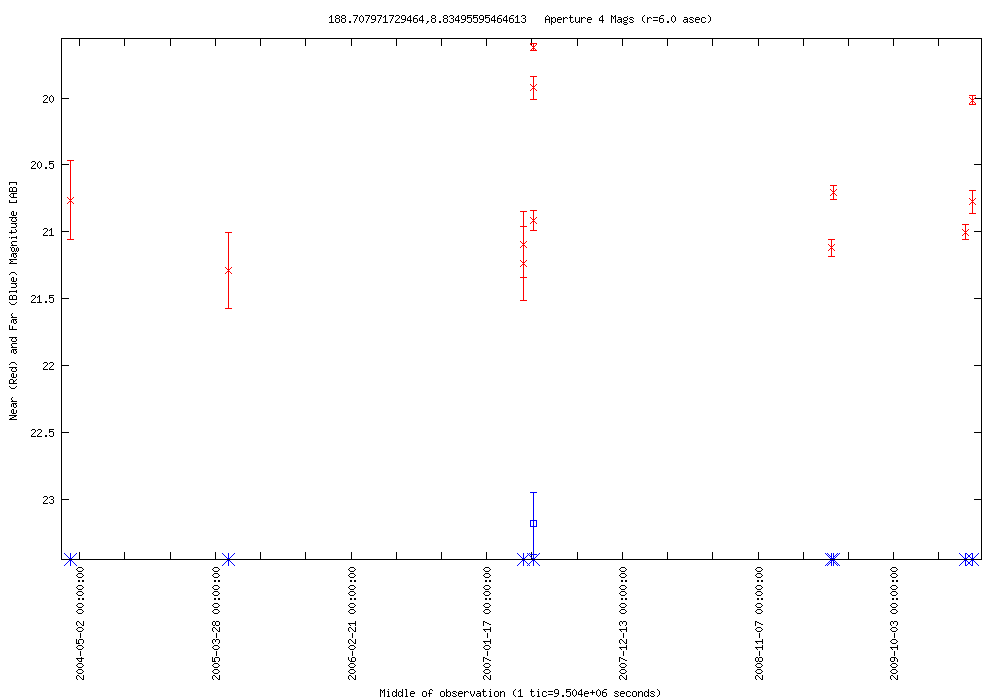
| 2010-04-11 23:50:55-07 | 188.70797 +08.83496 | 1.498 | 19.619 | 8 | 0.000 | 23.177 | 1 | RR Lyrae? | SDSS J123449.91+085005.7 | blue star | NED Simbad SDSS |  |
LC Plot |
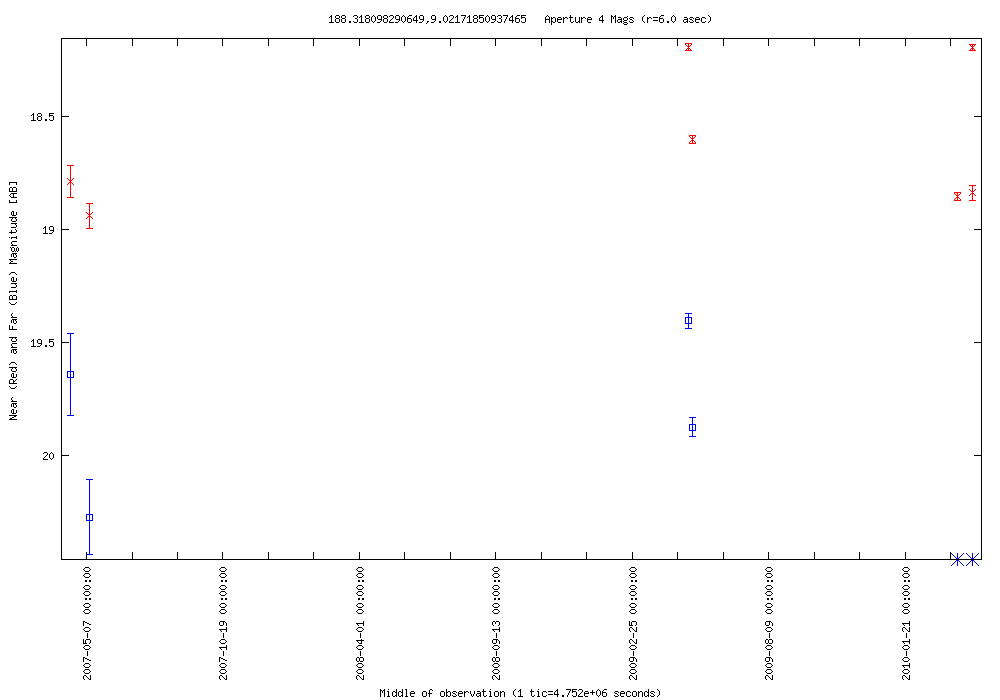
| 2010-04-11 23:50:55-07 | 188.31810 +09.02172 | 0.660 | 18.192 | 5 | 0.470 | 19.405 | 2 | RR Lyrae? | - | near bright star | NED Simbad SDSS |  |
LC Plot |
| 2010-04-11 15:38:03-07 | 192.14581 +15.58636 | 0.728 | 21.114 | 4 | 0.011 | 21.921 | 2 | AGN? | SDSS J124834.94+153509.9 | SDSS classified as a star | NED Simbad SDSS | |
LC Plot |
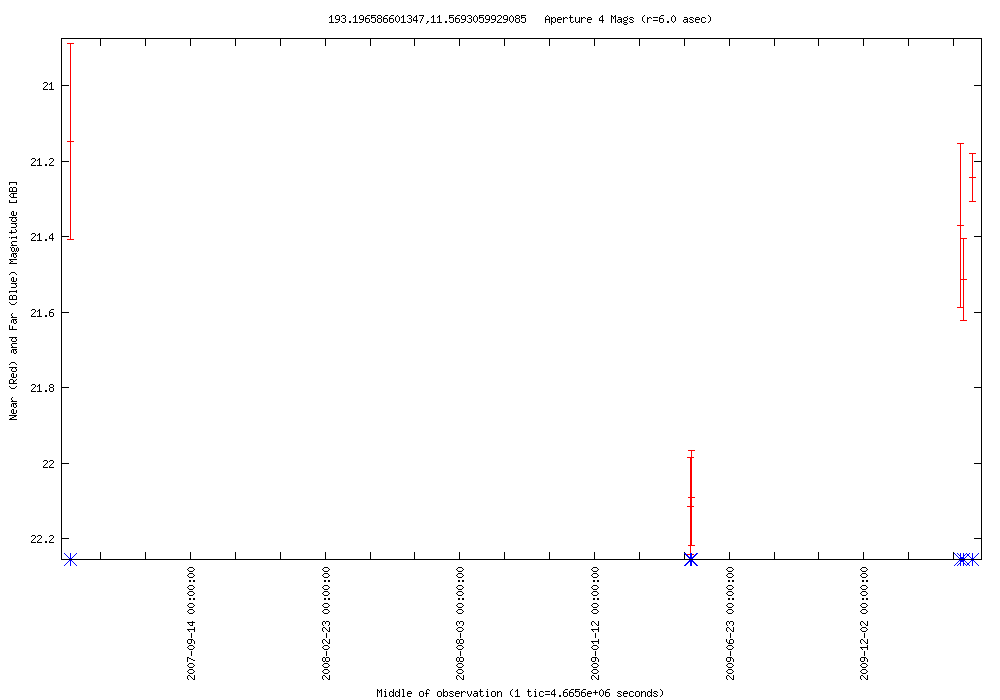
| 2010-04-11 13:59:28-07 | 193.19659 +11.56931 | 0.870 | 21.243 | 5 | 0.000 | 0.000 | 0 | AGN? | SDSS J125247.21+113409.5 | SDSS classified as a galaxy | NED Simbad SDSS |  |
LC Plot |
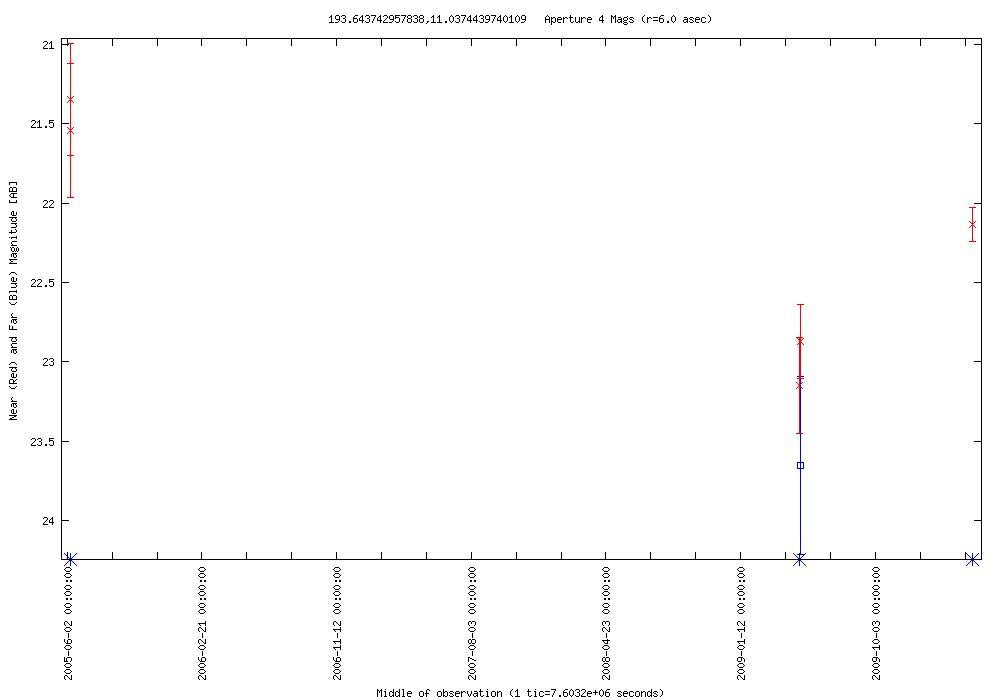
| 2010-04-11 13:59:28-07 | 193.64374 +11.03744 | 1.017 | 22.133 | 3 | 0.000 | 23.654 | 1 | AGN? | SDSS J125434.49+110214.5 | SDSS classified as a star | NED Simbad SDSS |  |
LC Plot |
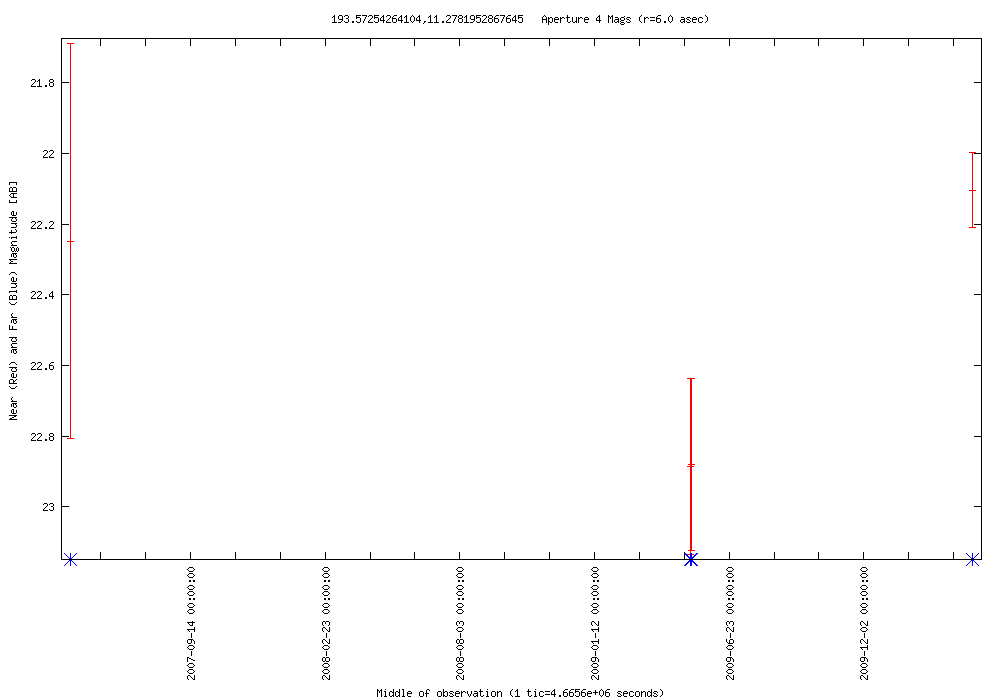
| 2010-04-11 13:59:28-07 | 193.57254 +11.27820 | 0.782 | 22.104 | 3 | 0.000 | 0.000 | 0 | AGN? | SDSS J125417.43+111640.7 | SDSS classified as a star | NED Simbad SDSS |  |
LC Plot |
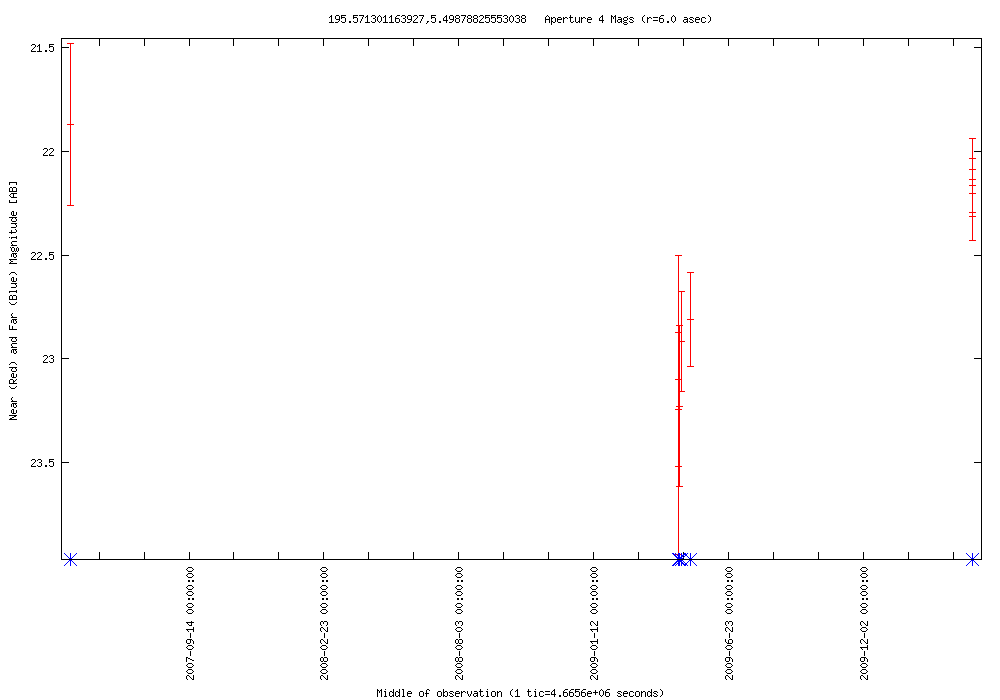
| 2010-04-11 12:20:54-07 | 195.57130 +05.49879 | 1.486 | 22.036 | 8 | 0.000 | 0.000 | 0 | AGN? | SDSS J130217.01+052956.5 | SDSS classified as a galaxy | NED Simbad SDSS |  |
LC Plot |
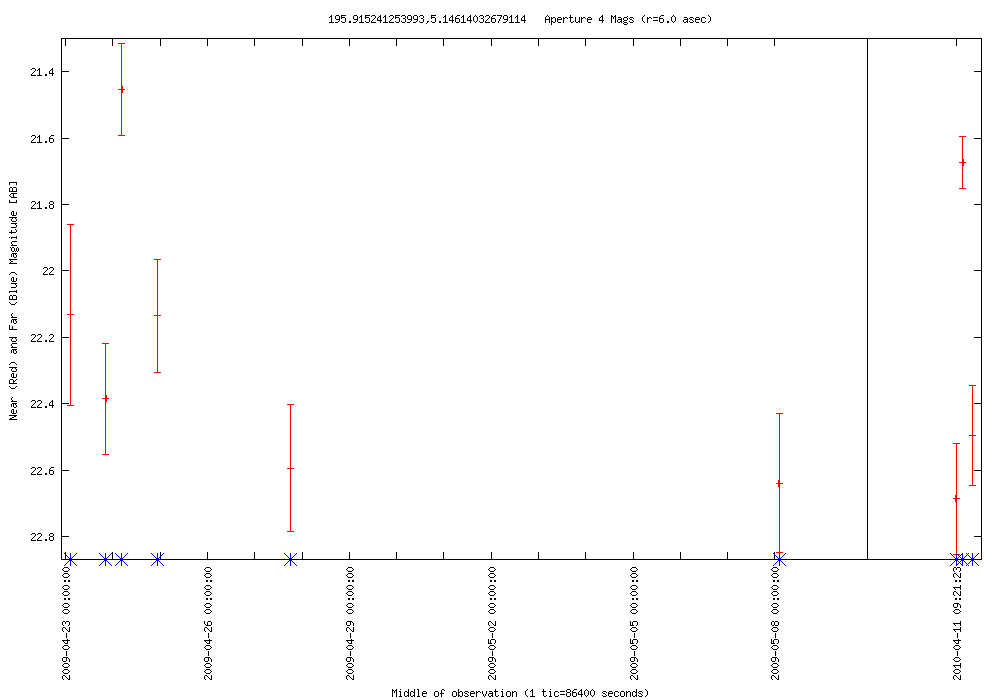
| 2010-04-11 12:20:54-07 | 195.91524 +05.14614 | 1.232 | 21.454 | 9 | 0.000 | 0.000 | 0 | AGN? | SDSS J130339.64+050847.0 | blue, stellar | NED Simbad SDSS |  |
LC Plot |
| 2010-04-11 09:03:45-07 | 195.82161 +04.82228 | 1.011 | 19.587 | 11 | 0.000 | 23.061 | 1 | RR Lyrae? | SDSS J130317.08+044919.3 | blue star | NED Simbad SDSS | |
LC Plot |
| 2010-04-11 09:03:45-07 | 195.29168 +05.14121 | 2.483 | 18.222 | 10 | 3.817 | 19.218 | 4 | Flare star? | SDSS J130109.93+050828.5 | dropped 2+ mags in 22 hr | NED Simbad SDSS | |
LC Plot |
| 2010-04-11 09:03:45-07 | 195.65863 +05.18567 | 1.112 | 19.284 | 10 | 0.000 | 0.000 | 0 | Semi-regular pulsator | RT Vir | SDSS shows bright, red star | NED Simbad SDSS | |
LC Plot |
| 2010-04-11 07:25:10-07 | 202.13866 --22.89423 | 2.327 | 18.297 | 12 | 0.000 | 19.436 | 1 | HB star | HE 1325-2238 | RR Lyrae? | NED Simbad SDSS | |
LC Plot |
| 2010-04-11 07:25:10-07 | 202.45508 --23.33103 | 2.114 | 19.457 | 12 | 0.801 | 20.628 | 2 | DN? | - | blue star | NED Simbad SDSS | |
LC Plot |
| 2010-04-11 07:25:10-07 | 202.42808 --23.28131 | 2.398 | 15.244 | 12 | 0.256 | 22.800 | 2 | Mira | R Hya | Bright | NED Simbad SDSS | |
LC Plot |
| 2010-04-11 07:25:10-07 | 202.41637 --23.19688 | 2.804 | 18.528 | 12 | 2.804 | 19.580 | 4 | RR Lyrae? | - | blue star | NED Simbad SDSS | |
LC Plot |
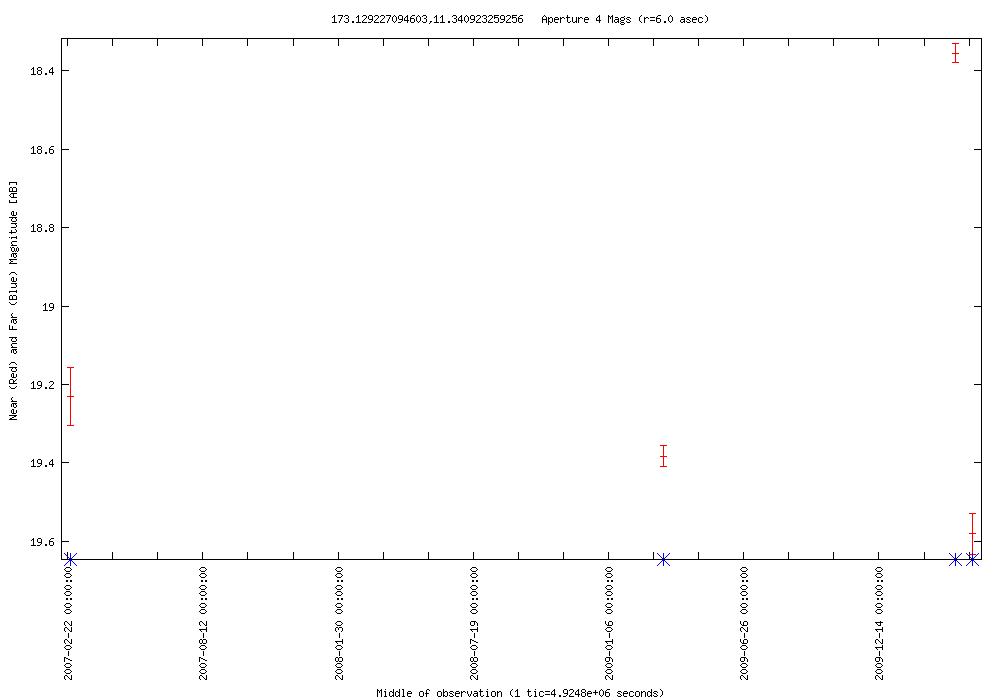
| 2010-04-11 05:46:36-07 | 173.12923 +11.34092 | 1.227 | 18.355 | 3 | 0.000 | 0.000 | 0 | RR Lyrae? | SDSS J113231.05+112027.4 | blue star | NED Simbad SDSS |  |
LC Plot |
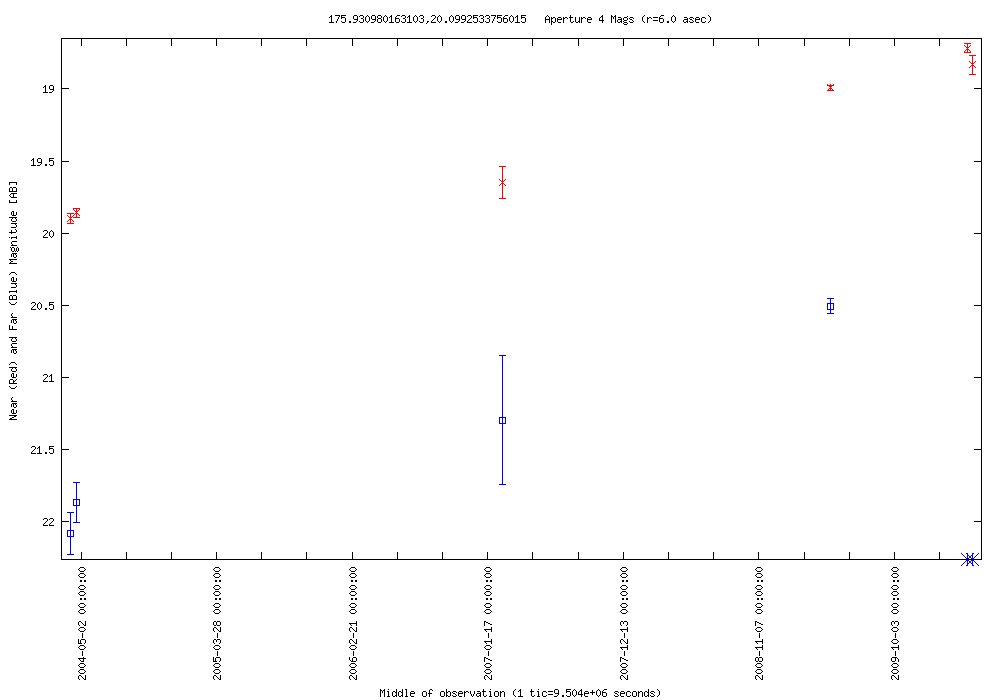
| 2010-04-11 02:29:27-07 | 175.93098 +20.09925 | 1.181 | 18.718 | 5 | 1.574 | 20.506 | 3 | QSO | [TEM98] 114107.70+202236.4 | z=1.06 | NED Simbad SDSS |  |
LC Plot |
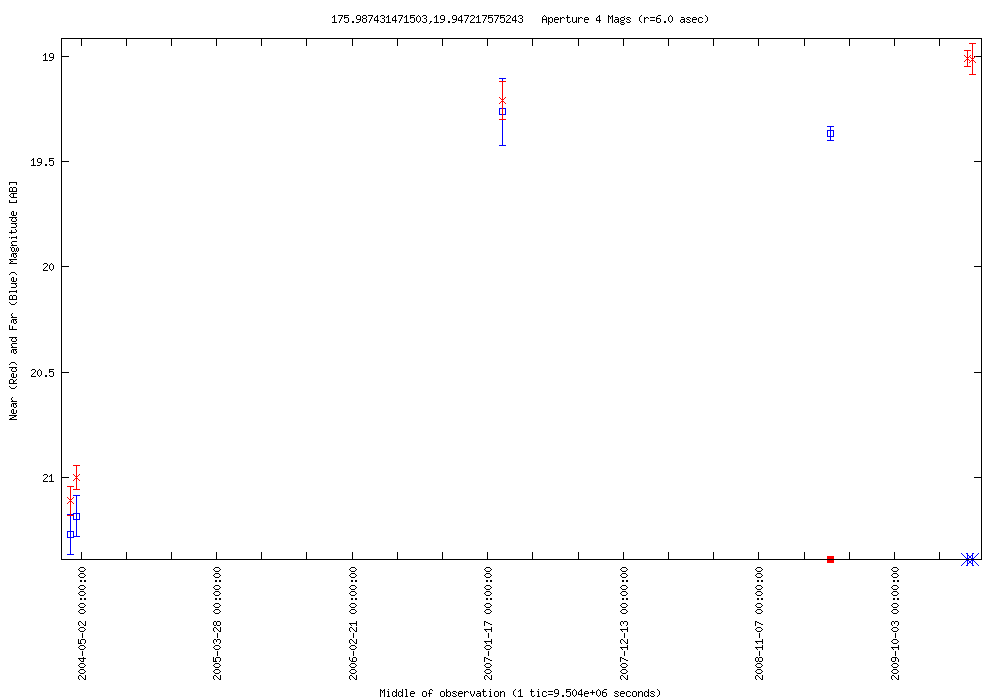
| 2010-04-11 02:29:27-07 | 175.98743 +19.94722 | 2.101 | 19.009 | 4 | 1.903 | 19.366 | 3 | QSO | [HB89] 1141+202 NED01 | SDSS classified as a galaxy | NED Simbad SDSS |  |
LC Plot |
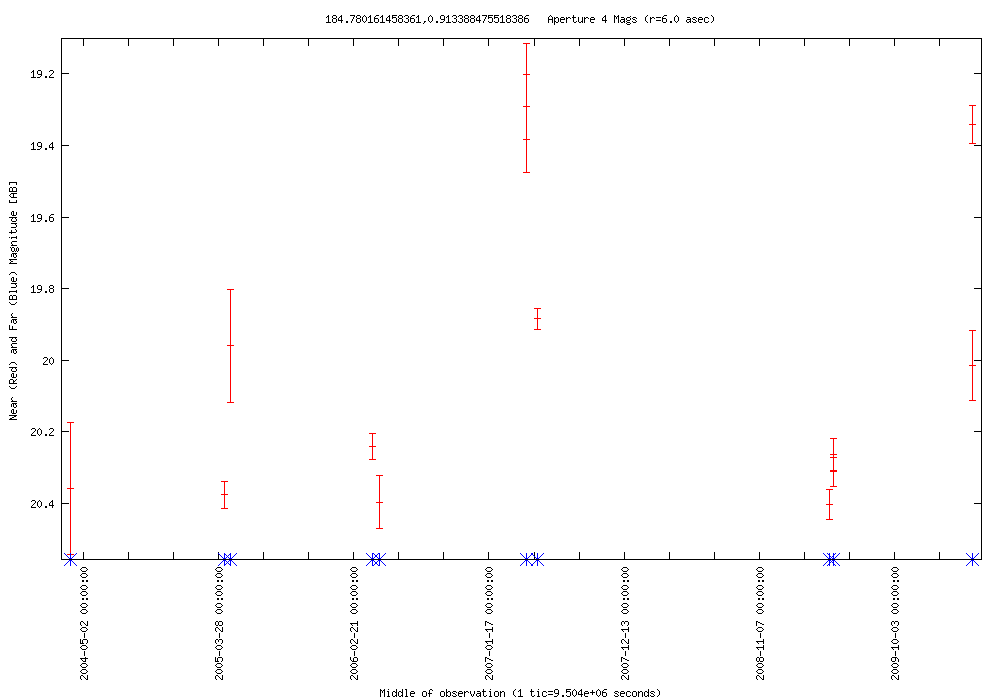
| 2010-04-11 00:50:52-07 | 184.78016 +00.91339 | 1.060 | 19.343 | 9 | 0.000 | 0.000 | 0 | RR Lyrae? | SDSS J121907.23+005448.2 | blue star | NED Simbad SDSS |  |
LC Plot |
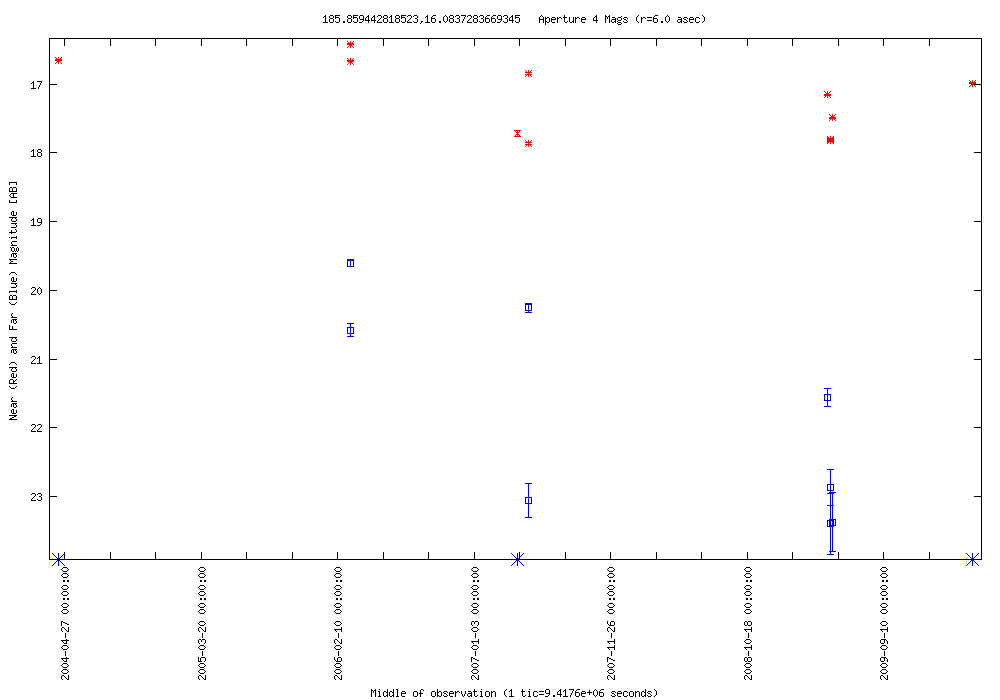
| 2010-04-10 16:37:59-07 | 185.85944 +16.08373 | 1.442 | 16.415 | 10 | 3.796 | 19.605 | 8 | RR Lyrae | CR Com | blue star | NED Simbad SDSS |  |
LC Plot |
| 2010-04-10 16:37:59-07 | 185.72643 +15.21891 | 1.891 | 20.627 | 6 | 0.000 | 22.634 | 1 | DN? | SDSS J122254.23+151307.5 | blue star | NED Simbad SDSS |  |
LC Plot |
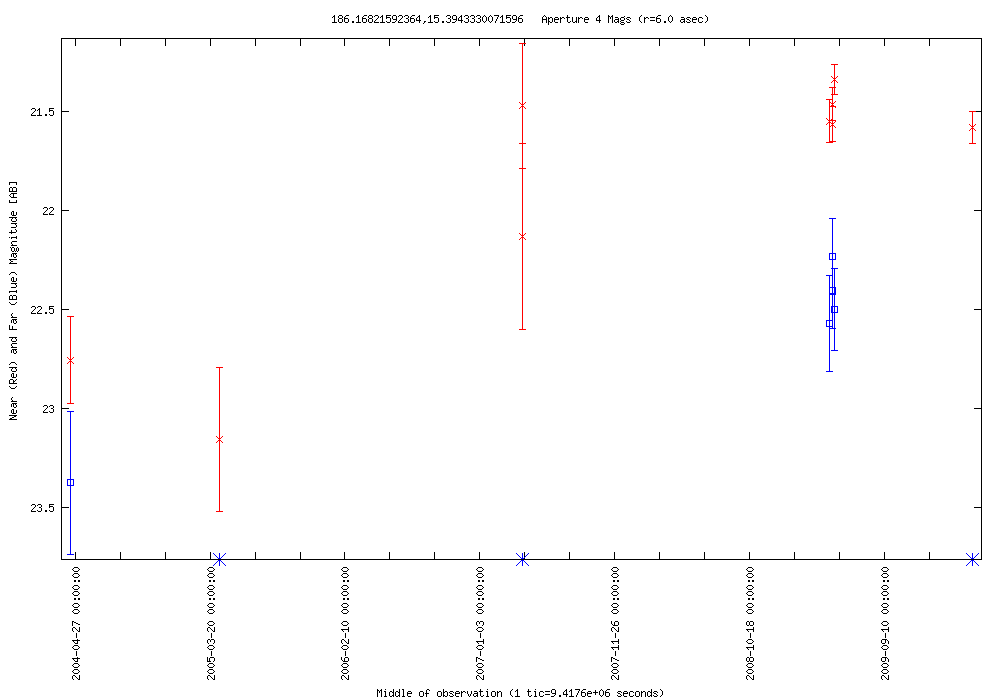
| 2010-04-10 16:37:59-07 | 186.16822 +15.39433 | 1.815 | 21.341 | 7 | 1.143 | 22.234 | 5 | AGN? | SDSS J122440.34+152339.4 | faint galaxy | NED Simbad SDSS |  |
LC Plot |
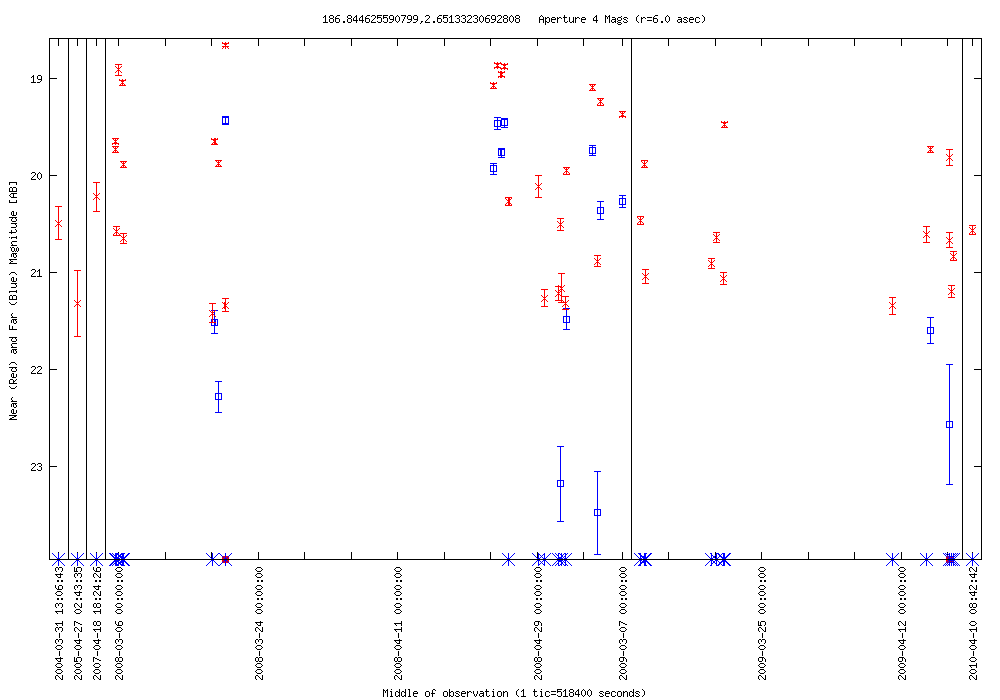
| 2010-04-10 08:25:06-07 | 186.84463 +02.65133 | 2.763 | 18.657 | 39 | 4.043 | 19.436 | 13 | RR Lyrae? | SDSS J122722.75+023903.9 | blue star | NED Simbad SDSS |  |
LC Plot |
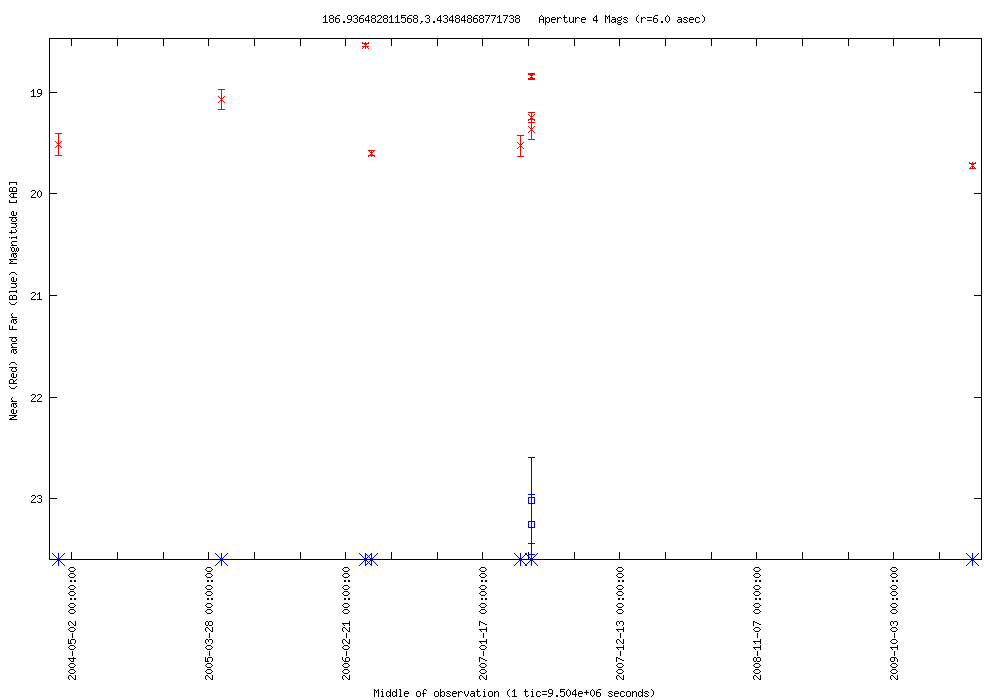
| 2010-04-10 08:25:06-07 | 186.93648 +03.43485 | 1.187 | 18.538 | 6 | 0.235 | 23.019 | 2 | RR Lyrae? | SDSS J122744.78+032606.8 | blue star | NED Simbad SDSS |  |
LC Plot |
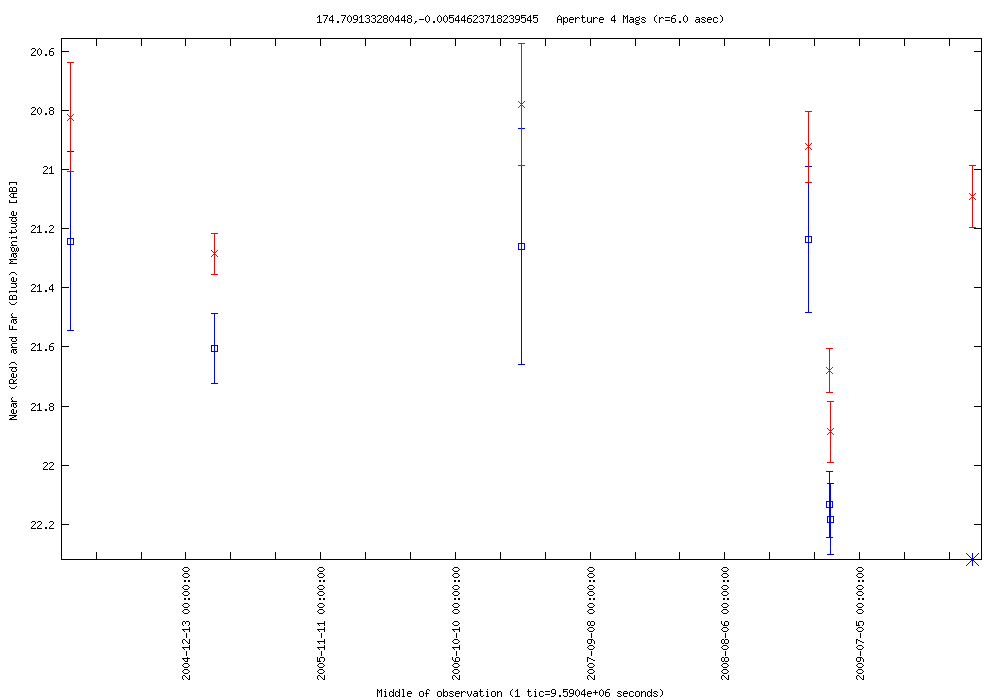
| 2010-04-10 05:07:56-07 | 174.70913 --0.00545 | 0.963 | 20.923 | 5 | 0.944 | 21.238 | 4 | AGN? | SDSS J113850.18-000018.8 | SDSS classified as a galaxy | NED Simbad SDSS |  |
LC Plot |
| 2010-04-09 19:16:28-07 | 186.17421 +17.09650 | 2.237 | 21.487 | 3 | 0.000 | 23.996 | 1 | Flare star? | SDSS J122441.83+170548.4 | aka 2MASS J12244191+1705486, High proper motion star | NED Simbad SDSS |  |
LC Plot |
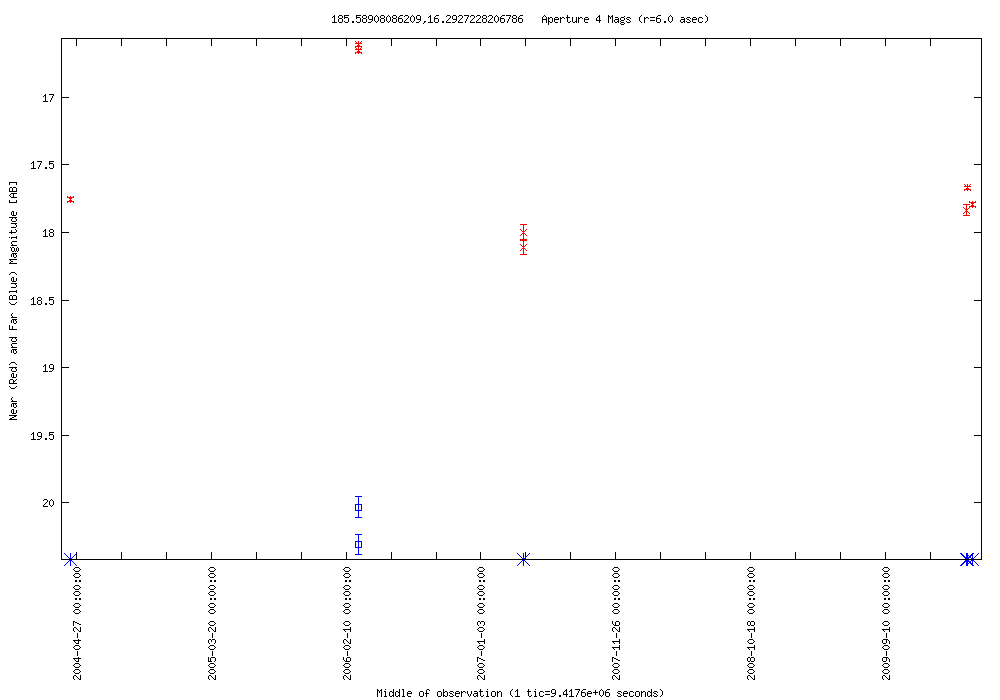
| 2010-04-09 19:16:28-07 | 185.58908 +16.29272 | 1.224 | 16.613 | 6 | 0.277 | 20.030 | 2 | RR Lyrae | TY Com | aka CQ Com | NED Simbad SDSS |  |
LC Plot |
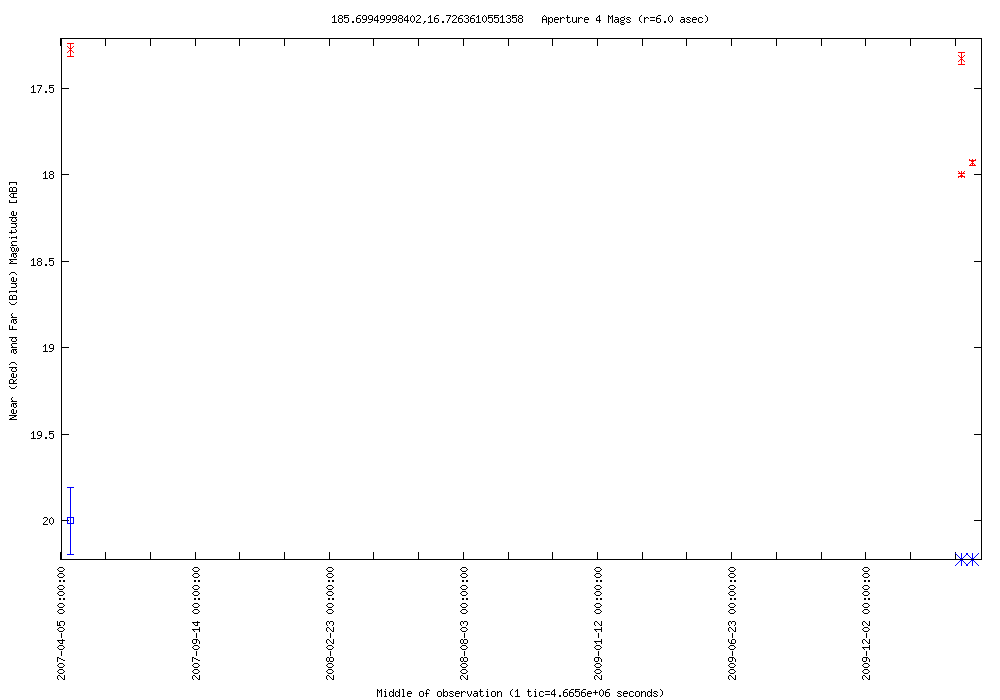
| 2010-04-09 19:16:28-07 | 185.69950 +16.72636 | 0.675 | 17.325 | 3 | 0.000 | 0.000 | 0 | RR Lyrae? | BPS BS 16470-0085 | blue star | NED Simbad SDSS |  |
LC Plot |
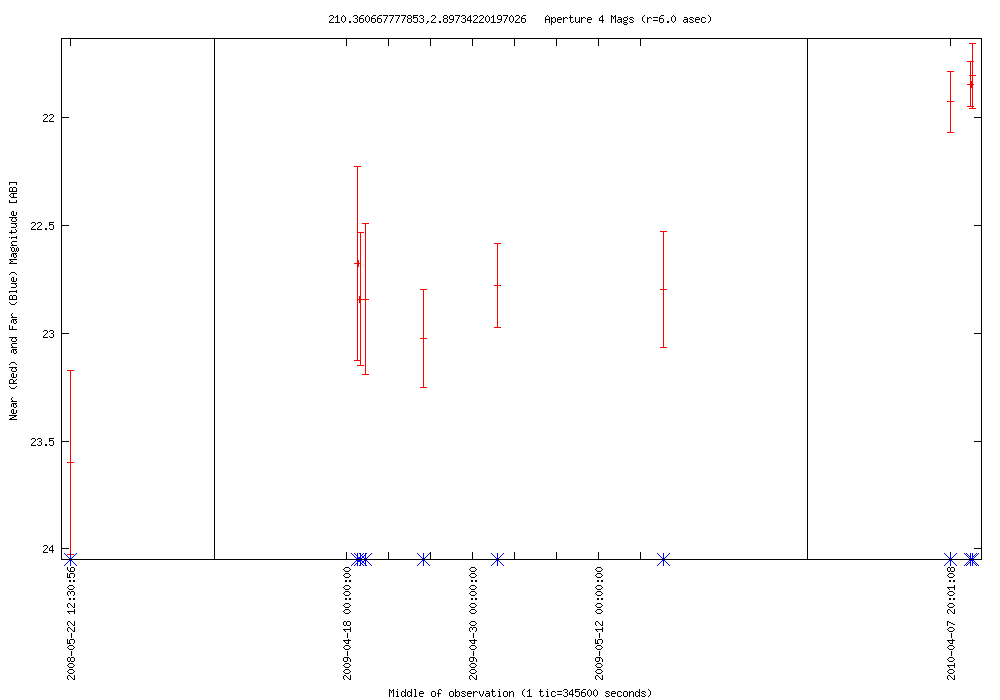
| 2010-04-09 17:37:53-07 | 210.36067 +02.89734 | 1.793 | 21.806 | 10 | 0.000 | 0.000 | 0 | AGN? | SDSS J140126.54+025349.9 | faint galaxy | NED Simbad SDSS |  |
LC Plot |
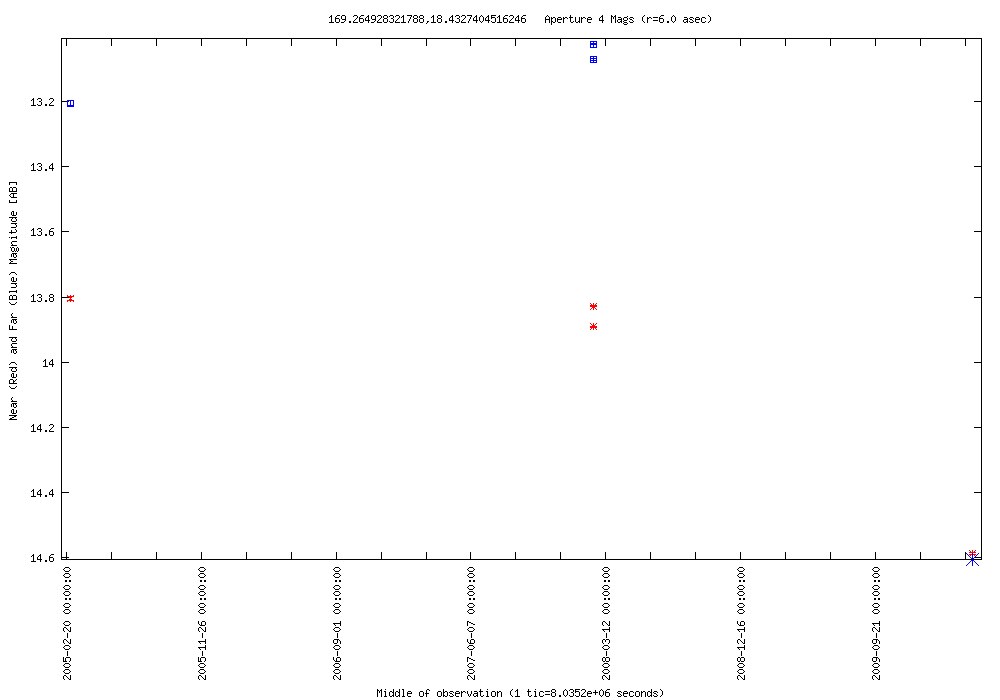
| 2010-04-09 12:42:09-07 | 169.26493 +18.43274 | 0.759 | 13.828 | 3 | 0.047 | 13.024 | 2 | CV | HK Leo | Bright | NED Simbad SDSS |  |
LC Plot |
| 2010-04-07 22:54:42-07 | 190.90293 +13.91207 | 1.784 | 19.464 | 7 | 0.000 | 0.000 | 0 | AGN? | SDSS J124336.65+135443.6 | SDSS classified as a star | NED Simbad SDSS | |
LC Plot |
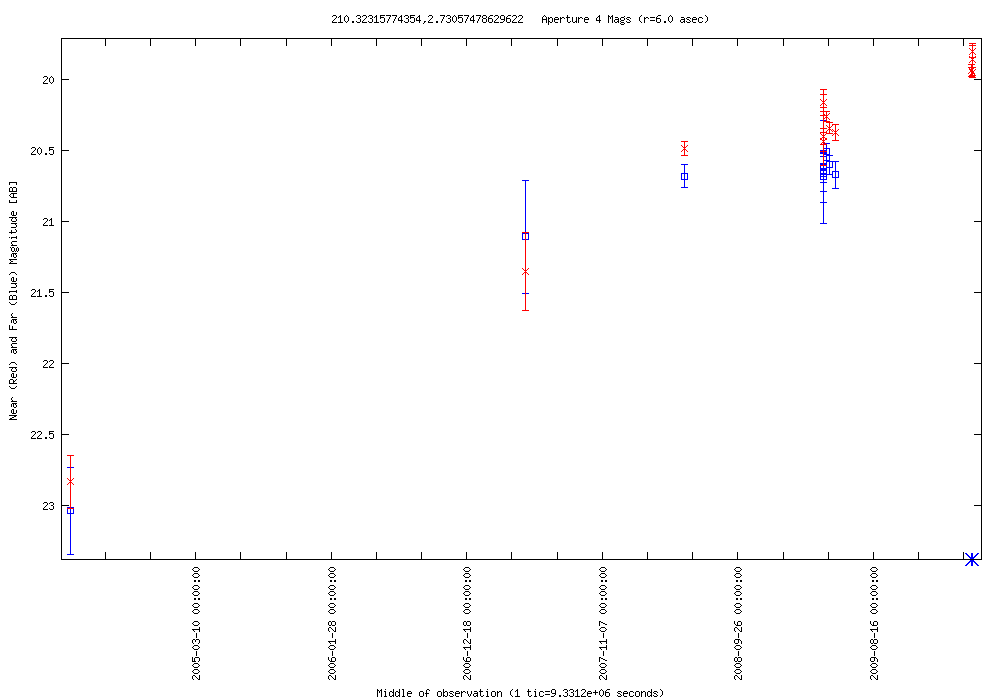
| 2010-04-07 19:37:32-07 | 210.32316 +02.73057 | 3.032 | 19.800 | 14 | 2.530 | 20.508 | 10 | X | HELLAS2XMM J140117.5+024349 | aka SDSS J140117.51+024350.2 | NED Simbad SDSS |  |
LC Plot |
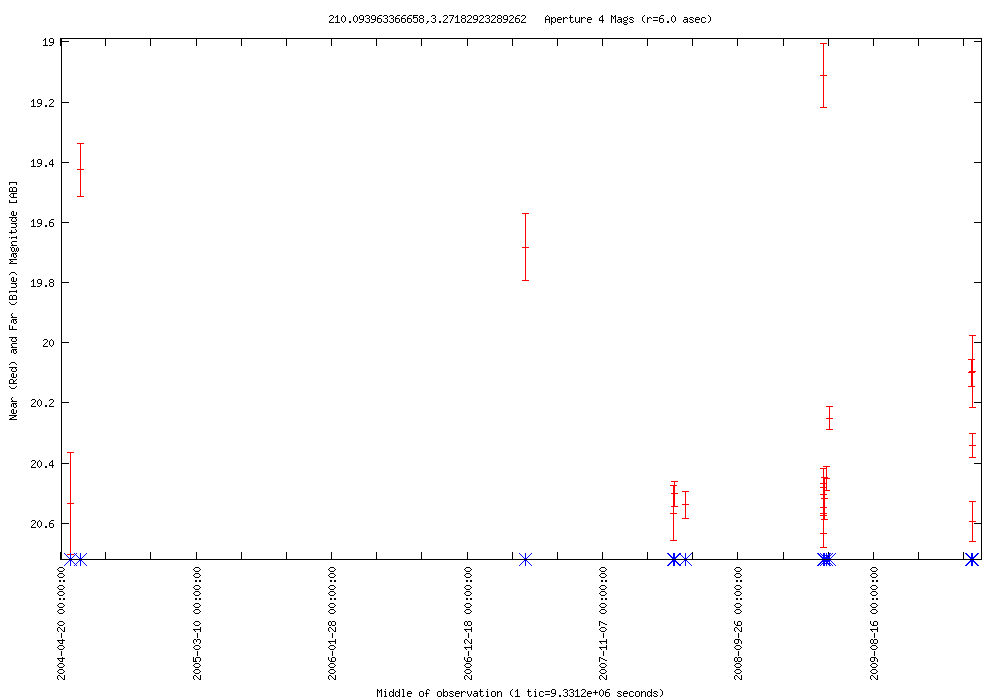
| 2010-04-07 19:37:32-07 | 210.09396 +03.27183 | 1.482 | 19.112 | 14 | 0.000 | 0.000 | 0 | RR Lyrae? | SDSS J140022.55+031618.7 | blue star | NED Simbad SDSS |  |
LC Plot |
| 2010-04-07 19:37:32-07 | 210.28924 +02.34959 | 1.462 | 18.429 | 13 | 0.518 | 21.650 | 4 | RR Lyrae? | SDSS J140109.38+022058.4 | blue star | NED Simbad SDSS |  |
LC Plot |
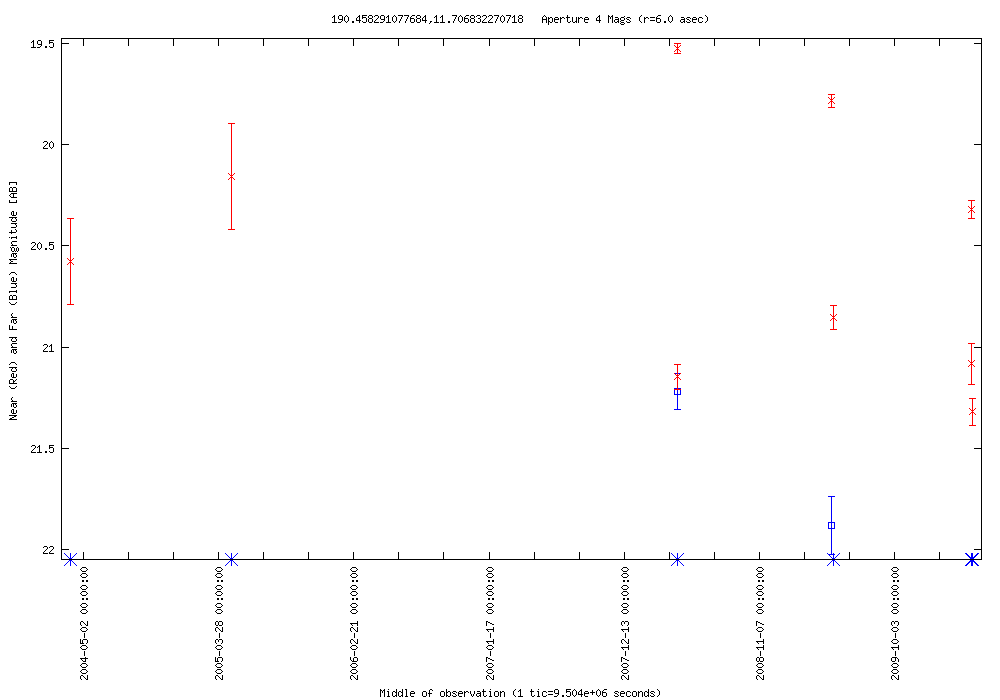
| 2010-04-07 17:58:57-07 | 190.45829 +11.70683 | 1.794 | 19.525 | 7 | 0.662 | 21.219 | 2 | RR Lyrae? | SDSS J124149.99+114224.1 | blue star | NED Simbad SDSS |  |
LC Plot |
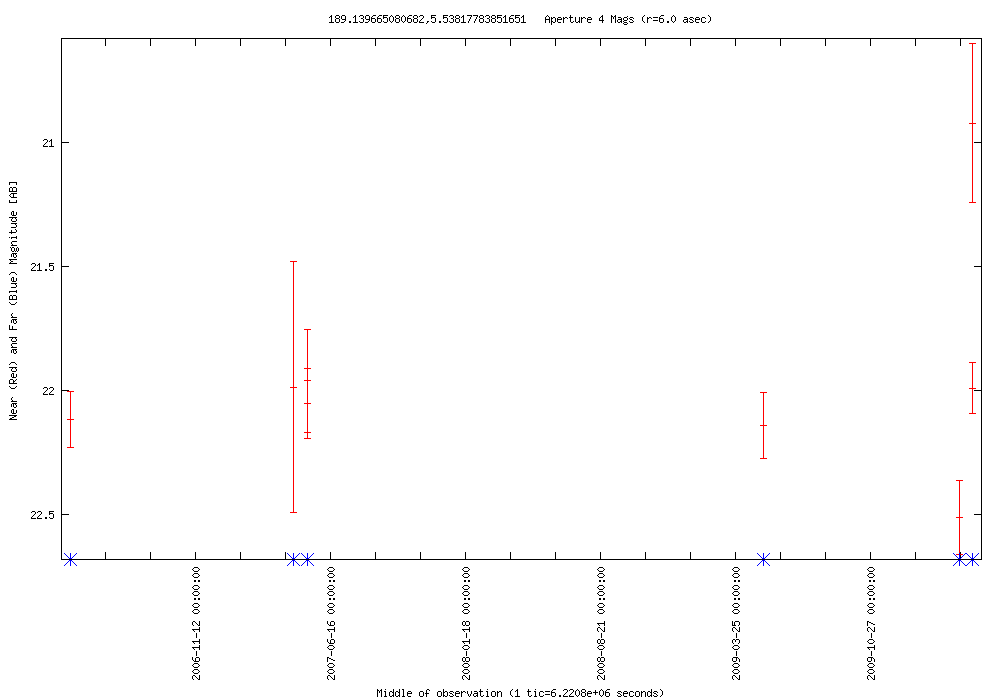
| 2010-04-07 14:41:46-07 | 189.13967 +05.53818 | 1.590 | 20.921 | 7 | 0.000 | 0.000 | 0 | DN? | SDSS J123633.41+053216.3 | blue star | NED Simbad SDSS |  |
LC Plot |
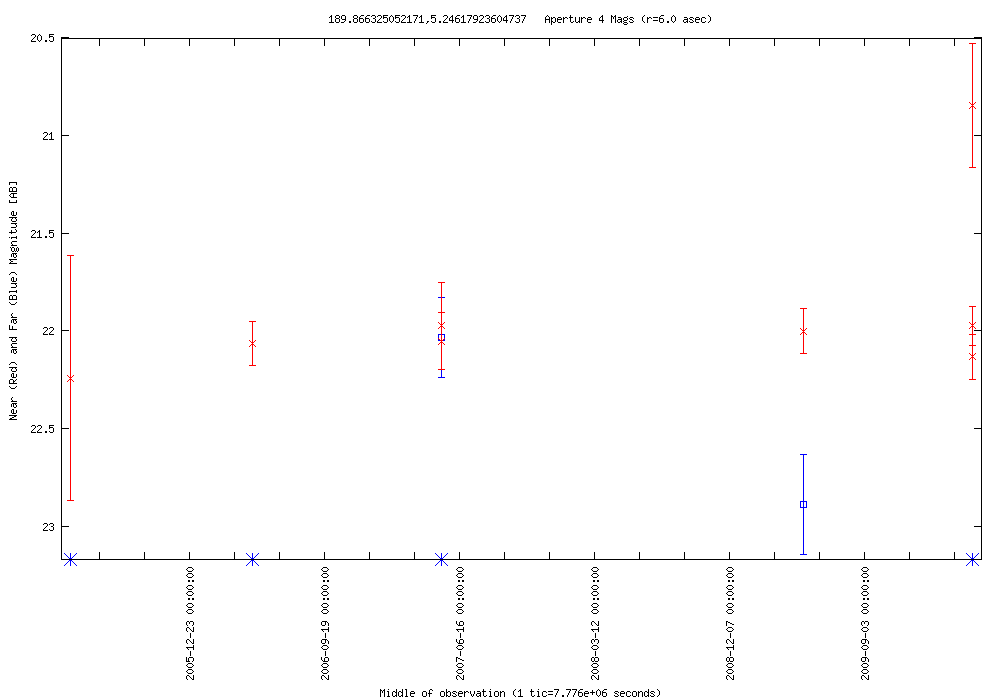
| 2010-04-07 14:41:46-07 | 189.86633 +05.24618 | 1.287 | 20.846 | 8 | 0.987 | 22.034 | 4 | AGN? | SDSS J123927.90+051447.9 | faint galaxy | NED Simbad SDSS |  |
LC Plot |
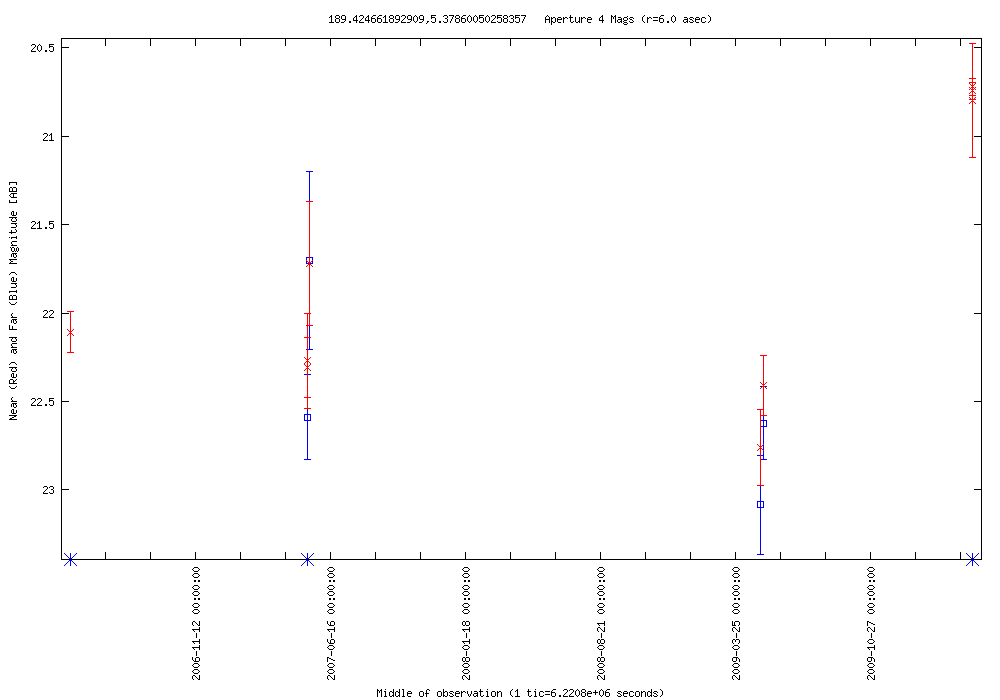
| 2010-04-07 14:41:46-07 | 189.42466 +05.37860 | 1.689 | 20.721 | 7 | 0.034 | 22.588 | 2 | AGN? | SDSS J123741.88+052243.2 | faint galaxy | NED Simbad SDSS |  |
LC Plot |
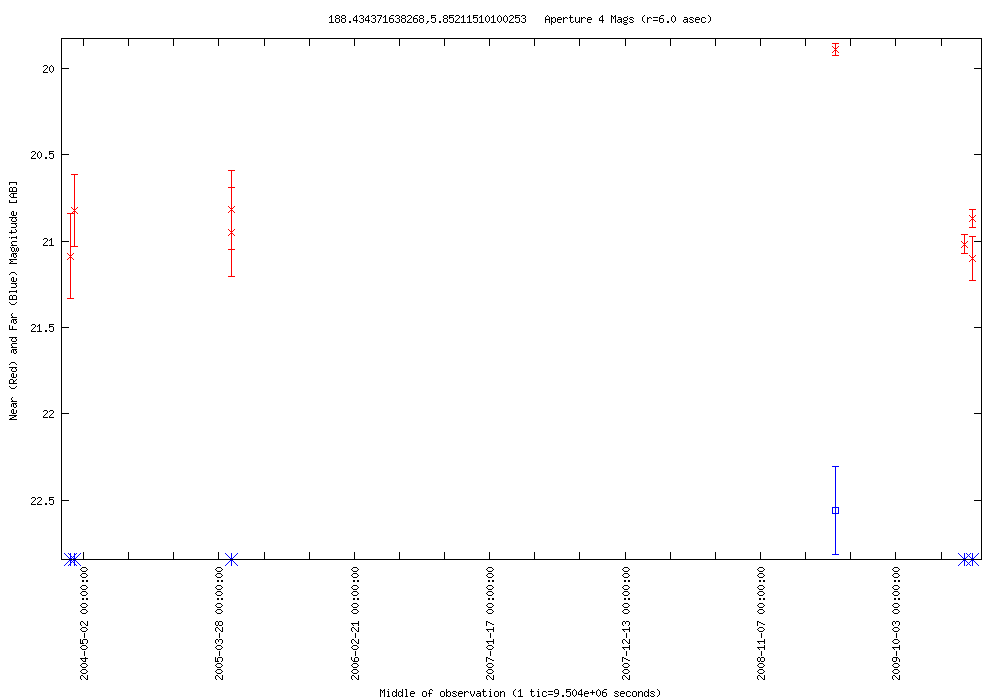
| 2010-04-07 09:46:00-07 | 188.43437 +05.85212 | 1.209 | 19.891 | 4 | 0.000 | 22.560 | 1 | RR Lyrae? | SDSS J123344.25+055106.8 | blue star | NED Simbad SDSS |  |
LC Plot |
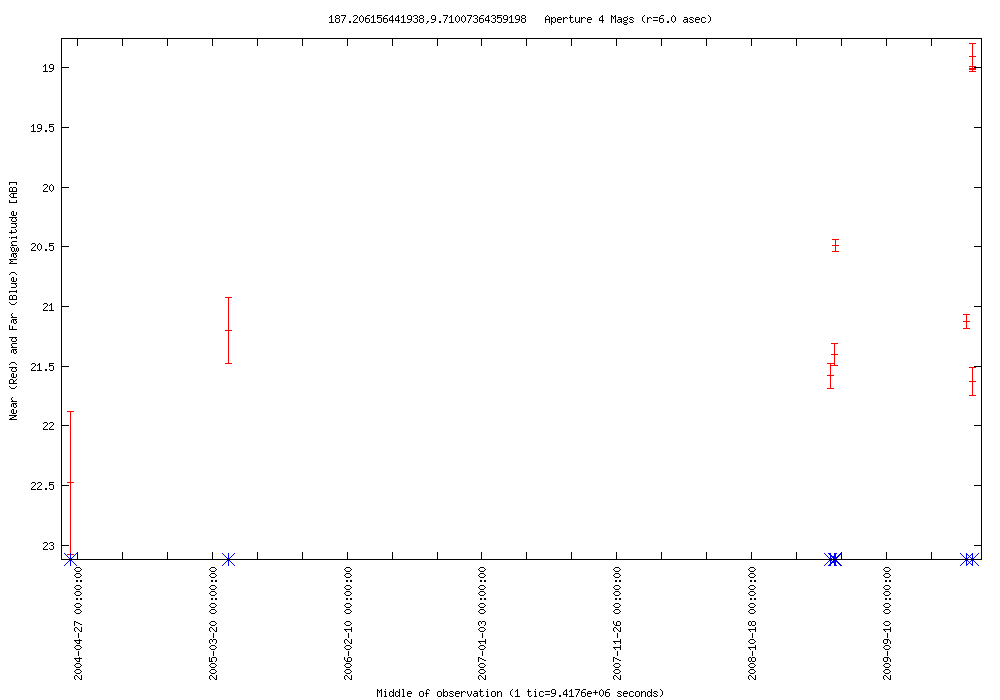
| 2010-04-06 23:54:27-07 | 187.20616 +09.71007 | 2.722 | 18.905 | 7 | 0.000 | 0.000 | 0 | AGN? | SDSS J122849.44+094235.9 | SDSS classified as a star | NED Simbad SDSS |  |
LC Plot |
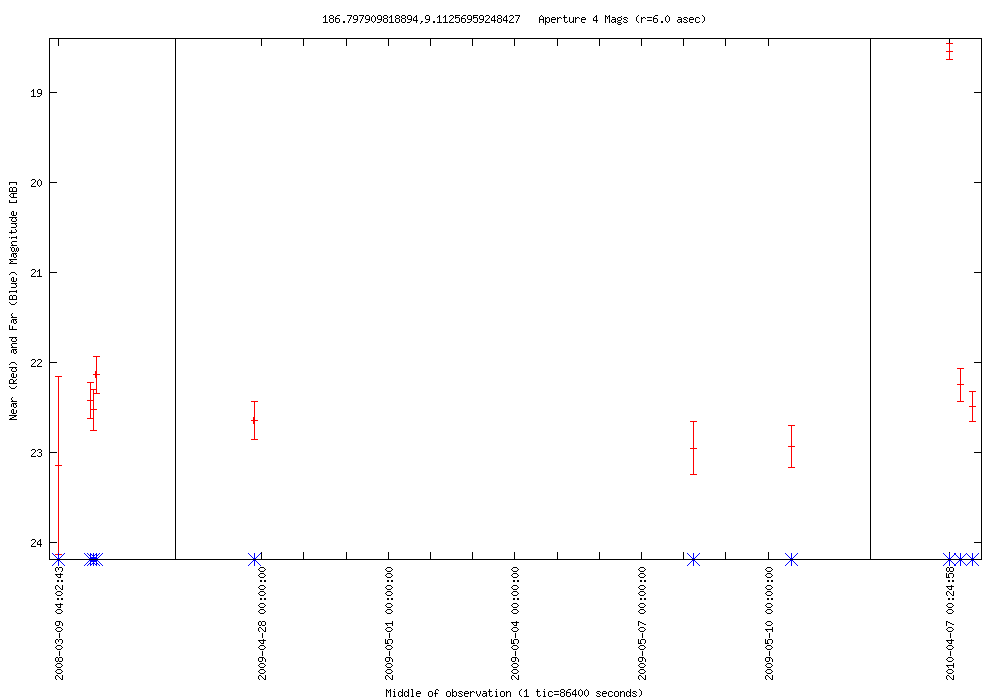
| 2010-04-06 23:54:27-07 | 186.79791 +09.11257 | 4.604 | 18.543 | 10 | 0.000 | 0.000 | 0 | Flare star? | SDSS J122711.42+090647.1 | Red star | NED Simbad SDSS |  |
LC Plot |
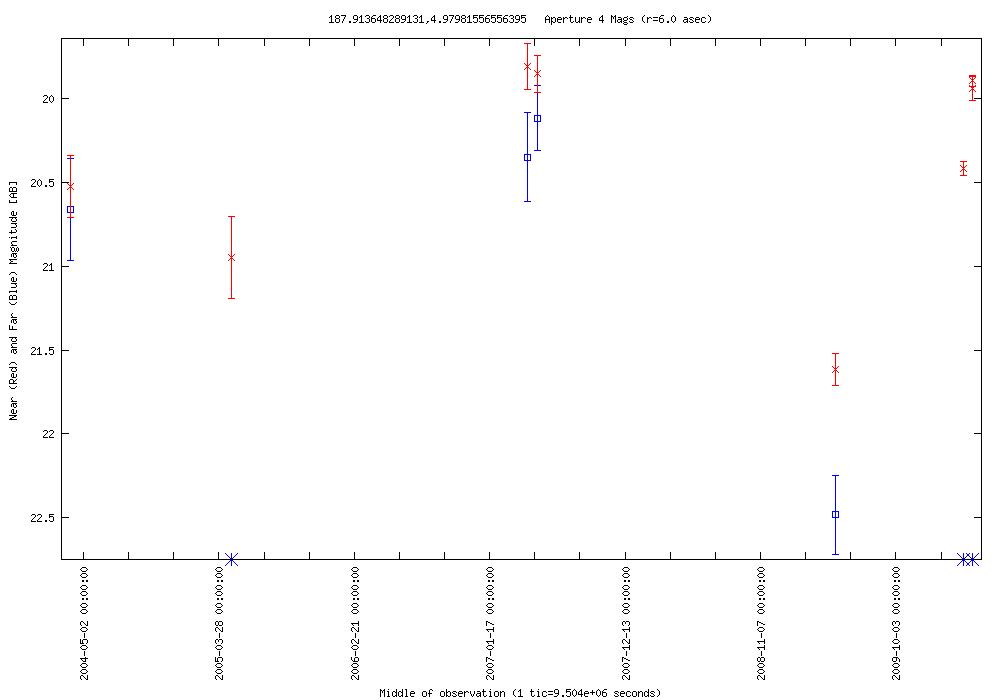
| 2010-04-06 22:15:52-07 | 187.91365 +04.97982 | 1.720 | 19.895 | 4 | 0.000 | 22.483 | 1 | AGN? | SDSS J123139.27+045848.6 | SDSS classified as a galaxy | NED Simbad SDSS |  |
LC Plot |
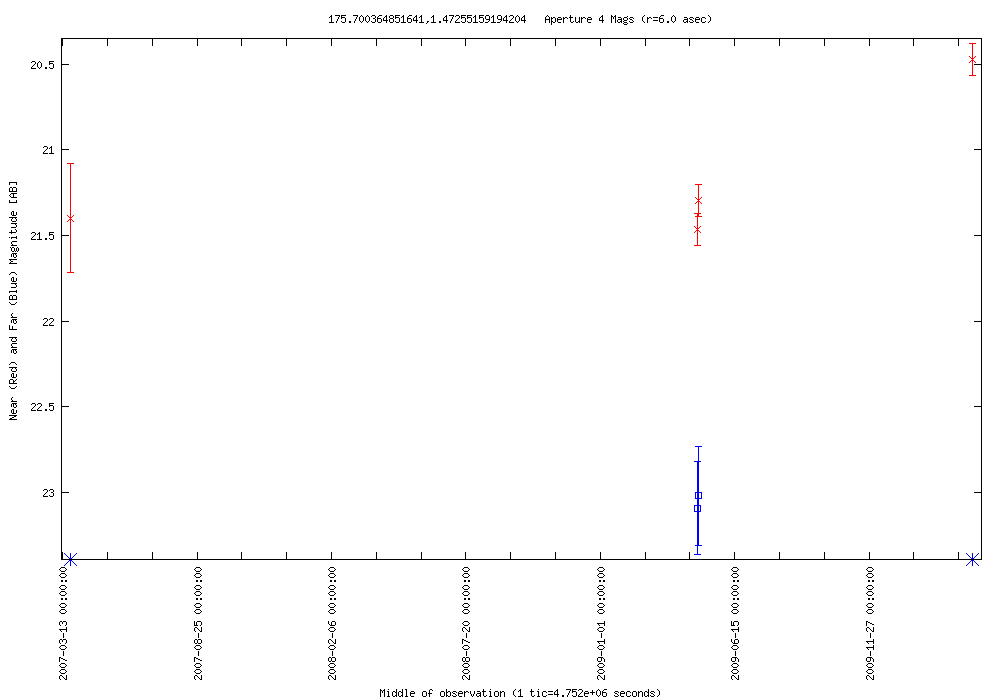
| 2010-04-02 21:18:33-07 | 175.70036 +01.47255 | 0.994 | 20.471 | 3 | 0.072 | 23.019 | 2 | QSO | SDSS J114248.04+012821.1 | z=1.12 | NED Simbad SDSS |  |
LC Plot |
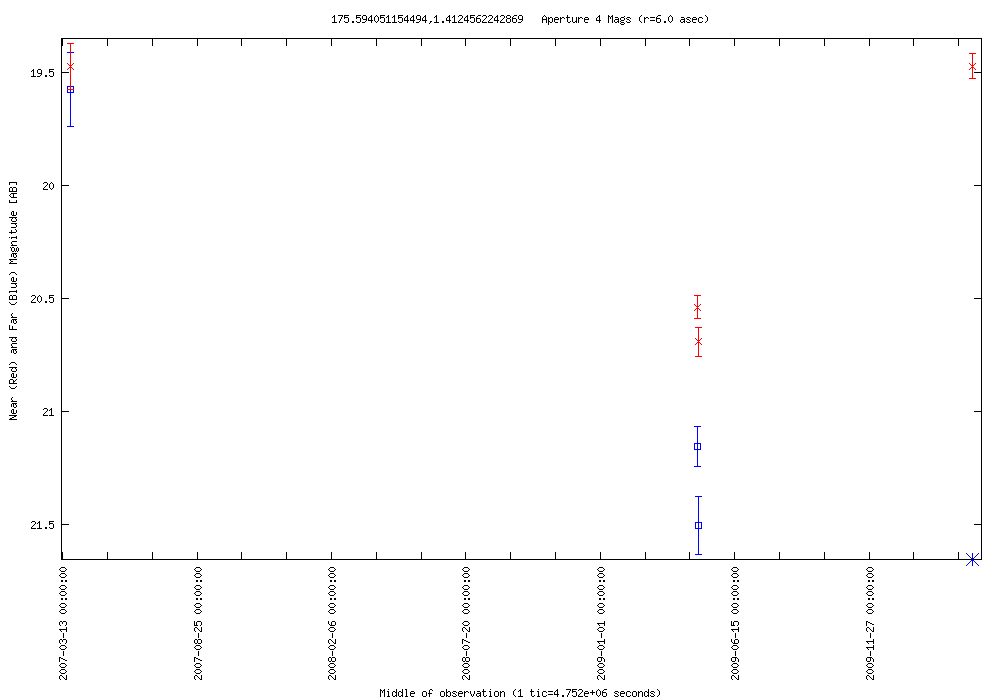
| 2010-04-02 21:18:33-07 | 175.59405 +01.41246 | 1.221 | 19.470 | 3 | 0.350 | 21.155 | 2 | QSO | SDSS J114222.52+012443.8 | z=0.48 | NED Simbad SDSS |  |
LC Plot |
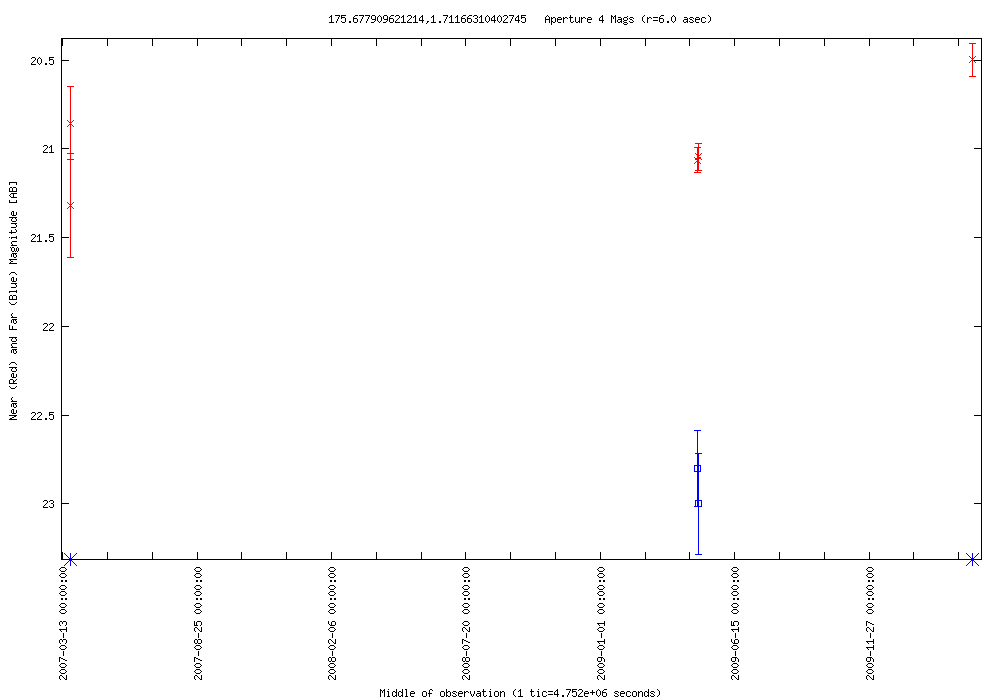
| 2010-04-02 21:18:33-07 | 175.67791 +01.71166 | 0.565 | 20.498 | 3 | 0.199 | 22.801 | 2 | QSO | SDSS J114242.64+014242.5 | z=1.34 | NED Simbad SDSS |  |
LC Plot |
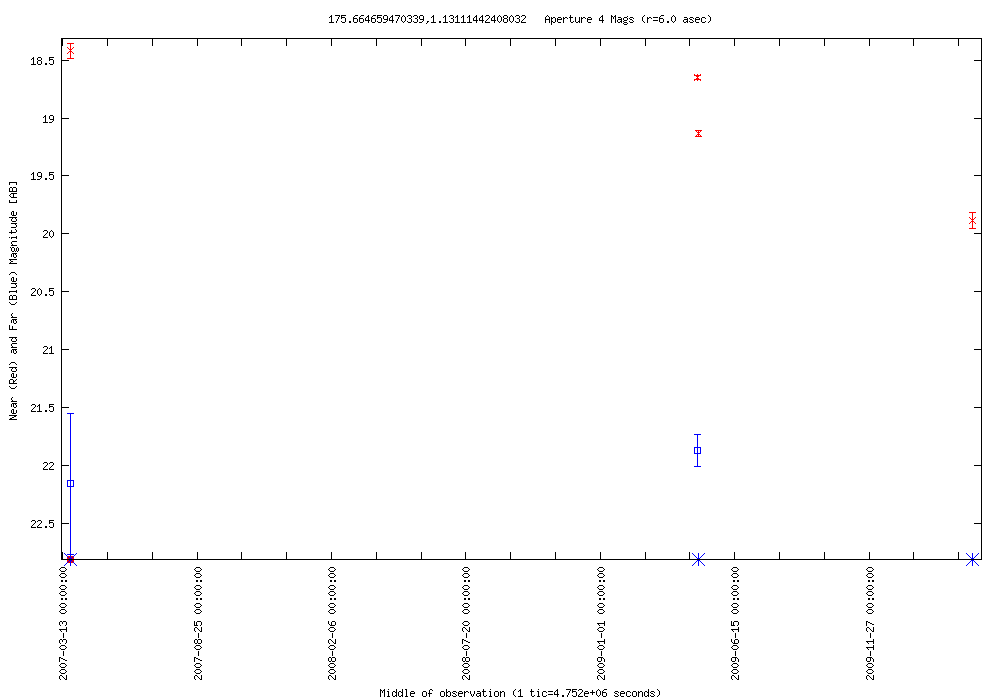
| 2010-04-02 21:18:33-07 | 175.66466 +01.13111 | 1.235 | 18.647 | 3 | 0.000 | 21.873 | 1 | RR Lyrae? | SDSS J114239.48+010752.3 | SDSS classified as a star | NED Simbad SDSS |  |
LC Plot |
| 2010-04-01 14:05:06-07 | 190.90293 +13.91207 | 0.761 | 20.324 | 3 | 0.000 | 0.000 | 0 | AGN? | SDSS J124336.65+135443.6 | SDSS classified as a star | NED Simbad SDSS | |
LC Plot |
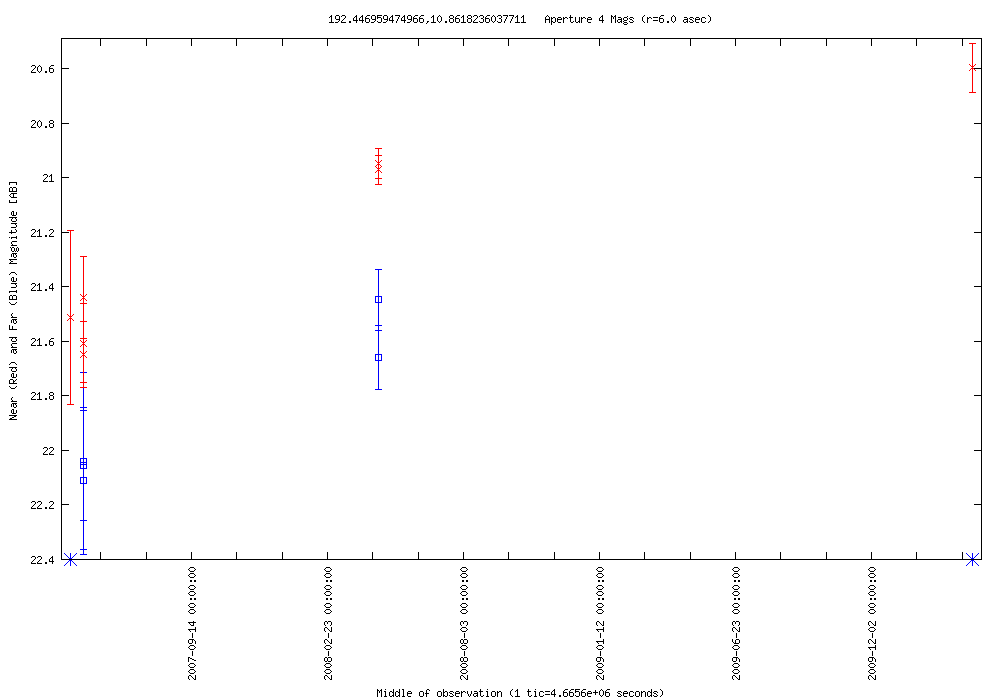
| 2010-04-01 04:13:29-07 | 192.44696 +10.86182 | 1.052 | 20.596 | 6 | 0.665 | 21.448 | 5 | AGN? | SDSS J124947.19+105142.6 | SDSS classified as a star | NED Simbad SDSS |  |
LC Plot |

